
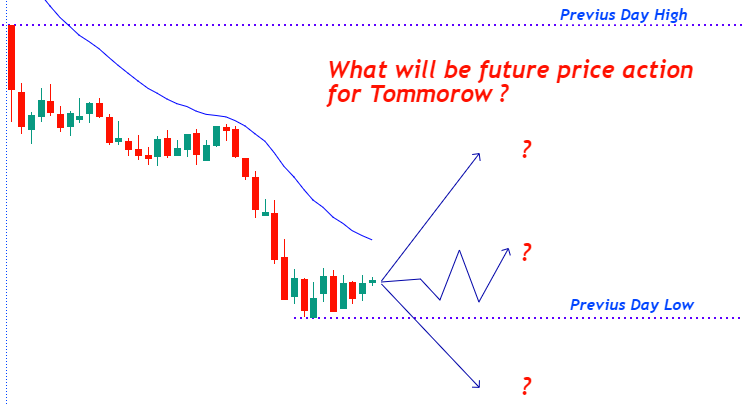
Every trader who opens the chart after-market hours or during pre-market analysis faces the same question: “How to do Nifty Analysis for Tomorrow?”
Whether you are an intraday F&O trader, a swing trader, or a positional investor, conducting a structured Nifty Analysis for Tomorrow prepares you with a trading plan before the opening bell.
But why is tomorrow so important? Because price action unfolds in phases.
-
- Today’s close, high & low provide context,
- Tomorrow’s open provides confirmation, and
- The trend in-between creates opportunity.
Successful traders do not chase every candle. They analyze, prepare, and manage risk just like institutional smart money.
Note: In this article, I will briefly explain how I perform my pre-market analysis, the key pillars of Technical Analysis I rely on, and the main components I use during live trading that appear on my charts.
Nifty Analysis for Tomorrow
Technical analysis is not just about indicators or chart patterns. It is about reading the language of price action. Behind every candlestick lies a story of buyers, sellers, and their constant tug-of-war. If you want to understand Nifty possible moves for tomorrow, you must go beyond surface-level setups and uncover the hidden dynamics of supply and demand.
Think about these questions before you mark any level or place any trade:
-
- Is volatility expanding or contracting? What does that reveal about upcoming market behavior?
- Is momentum accelerating or losing steam? Are trends gaining strength or preparing to reverse?
- How do today’s price swings compare with past swings are moves becoming sharper or weaker?
- Do you see absorption zones, where strong buying or selling is quietly happening despite the price holding steady?
By answering such questions, you are no longer just looking at charts, you are analyzing market sentiment and trader psychology. This shift gives you a more reliable decision-making framework than relying solely on traditional technical analysis.
Now, let’s break down the Five Key Piller of technical analysis used by me for Nifty analysis tomorrow, tools that combine traditional technical with deeper price action.
Pre-Market Nifty Analysis for Tomorrow & Trading Blueprint
A well-structured pre-market routine is the foundation of successful day trading. Professional traders do not just show up when the bell rings; they prepare extensively before the market opens. The key to staying ahead in the markets is anticipation, not reaction. Pre-market analysis helps traders gauge market sentiment, identify potential trade setups, and define risk management strategies before volatility picks up.
Why is Pre-Market Preparation Important?
The stock market opens at 9:15 a.m. (IST), but successful traders begin their preparation hours earlier. A structured pre-market routine gives clarity, reduces emotional trades, and builds confidence.
- Spot impactful news early & assess global sentiment..
- Mark key technical levels (support/resistance, PDH/PDL, CPR).
- Enter the market with a clear bias, not impulse.
Without proper pre-market preparation, trading is like skydiving without a parachute and exposing yourself to unnecessary risks and market swings.
Pre-Market Preparation Checklist
A disciplined pre-market routine ensures systematic execution. Below are key steps to complete before the opening bell:
Personal Readiness
Physical Health: Trading requires sharp focus and quick decision-making. Lack of sleep or poor nutrition can lead to mental fatigue and poor judgment.
Mental Readiness: Conduct breathing exercises, meditation, or visualization techniques to stay calm.
Self-Assessment: Ask yourself:
Am I well-rested?
Am I in the right mental space to trade?
Should I reduce my position size if I feel stressed?
Trading Preparation
- Platform Check: Ensure your trading platform, broker connection, and data feeds work properly.
- Review Past Trades: Analyze previous trades and identify lessons.
- Simulated Trading Practice: Use a market replay feature before going live.
- Set Trading Goals: Prioritize process-oriented goals like executing only high-probability setups and managing risk effectively.
Market Landscape & News Analysis
Pre-market research helps traders understand the bigger picture before taking trades.
- Global Market Trends
- Earnings Reports: Review key companies reporting earnings pre-market or after hours.
- Geopolitical Events: Monitor news like central bank rate decisions, inflation reports, and crude oil price movements.
Five Key Pillars of Technical Analysis
To analyze Nifty for tomorrow, I rely on five core pillars that blend traditional technical analysis with deeper insights from price action, market structure, and participant behavior. These pillars allow me to understand not just where price might go, but why it moves, helping to align trades with smart money and net order flow.
The five pillars are:
-
- Multiple Timeframe Analysis
- Trend Analysis
- Trading Setup Identification
- Risk Reward Analysis for each Area of Value
- Opening Range & Future Price Action
Let’s briefly discuss each of these.
- Multiple Timeframe Analysis
Multiple timeframe analysis is the Map and Compass for trading. Price behaves in patterns which repeat on different scales. That is why analyzing Nifty across multiple timeframes is critical.
-
- Daily Timeframe: My pre-market analysis starts with DTF as it provides key support/resistance levels, swing highs/lows, and broader market structure.
- Trading timeframe (10-min): I use the 10-minute chart as my primary trading timeframe. It is ideal for intraday traders because it captures mid-term momentum and highlights potential continuation or reversal setups. With only about 38 candles forming in a trading day, it keeps the analysis structured, clear, and manageable.
- 3 -min timeframe: For intraday traders; used for fine-tuning entries and exits.
Previously, I have discussed Multiple Timeframe Analysis, and I will be sharing more about each component of Technical Analysis in detail in the future under Tradonomics Volume Price Action Trader (VPAT). Multiple timeframe analysis is extremely crucial for understanding market structure and accurately identifying the trend.
2. Trend Analysis
Once multiple timeframes are assessed, the next step is trend analysis. This involves identifying the dominant direction of the market across timeframes and understanding the strength and sustainability of trends.
3. Trading Setup Identification
Once you have completed multiple timeframe analysis to understand the market structure and identified the dominant trend direction, the next step is to determine which setups you will trade.
The goal is to focus on setups with clearly defined risk and a higher probability of success, rather than chasing random price movements.
4. Risk-Reward Analysis for Each Area of Value
Every trade should be evaluated for risk-to-reward before execution:
-
- Define stop-loss levels using recent swing highs/lows or key S/R.
- Set profit targets at areas where price is likely to encounter selling/buying pressure.
- Ensure each trade offers a minimum 1:2 risk-to-reward ratio to remain profitable in the long run.
This disciplined approach prevents emotional decisions and ensures structured risk management.
5. Opening Range & Future Price Action
The market opening often sets the tone for the day. By analyzing the initial balance (price range during the first 15–30 minutes), you can anticipate likely intraday direction:
-
- If the opening range is inside the previous day range, expect consolidation or a breakout attempt later.
- If the opening breaks out of the previous day range, it signals a potential trend day.
Observe how price interacts with high-volume levels, pivots, and moving averages during the opening. This gives clues about smart money positioning at the start of the day.
Once the fundamental picture is clear, focus on technical analysis for precise trade Area of Value identification and trading setups.
Trading Strategy & Execution Blueprint
Most traders lose money not because they do not know technical analysis, but because they do not have a blueprint for execution. They may identify strong setups, but when it comes to pulling the trigger, they rely on emotion instead of structure. This is where a Trading Strategy & Execution Blueprint separates professionals from amateurs.
A trading strategy defines what you will trade, when you will trade, and how you will trade, while the execution blueprint ensures that you follow through with consistency. Without it, even the best technical knowledge becomes useless.
Think of it this way:
- Strategy = the architect’s design of your trading house.
- Execution = the builder’s work that brings the design to life.
If the design is weak, the house collapses. If the builder makes mistakes, the house still collapses. You need both Trading Strategies and Execution for success.
Core Components of a Trading Strategy & Execution
A strong trading blueprint is not just about spotting charts; it is about following a structured process from trade entry to exit. Every trade goes through the same sequence:
Setup → Risk → Reward → Entry → Exit → Reflection
Let’s break down each step in detail:
1. Trading Setup Identification (with Risk–Reward Analysis)
The starting point of every trade is identifying a high-probability setup. This means recognizing areas of value where supply and demand imbalances are clear and where smart money is likely active.
- Look for setups at key levels such as CPR, PDH/PDL, PRNs, or major support/resistance zones.
- Confirm setups with volume-price analysis to separate real breakouts from false moves.
- Before moving forward, define the risk–reward profile:
- Where is your stop-loss (risk)?
- Where is your logical profit target (reward)?
- Does the trade offer at least a 1:2 ratio?
If the setup doesn’t meet the minimum risk–reward requirement, skip it. Discipline here saves you from overtrading.
2. Entry Criteria
Once the setup is clear and the risk–reward is favorable, the next step is deciding when to enter. Entries should be precise, not random.
- Trend-based entries: Buy pullbacks in an uptrend, sell rallies in a downtrend.
- Breakout entries: Enter only when breakouts are supported by rising volume.
- Reversal entries: Use candlestick confirmations (engulfing, pin bar, doji) at major zones, especially when you identify trapped traders.
The goal is to enter with the market strength, not against it.
3. Risk Management
Even perfect setups can fail. Risk management protects your capital and keeps you in the game.
- Position sizing: Never risk more than 1–2% of your trading capital on a single trade.
- Stop-loss placement: Always place your stop where your trade idea is invalidated.
- Daily/weekly loss limits: Decide beforehand how much you are willing to lose. Once reached, step aside.
Risk management is survival. Without it, even the best setups cannot save your account.
4. Exit Strategy
Exits determine your profitability. A structured exit plan ensures you donot let emotions control your decision.
- Profit targets: Place them at logical levels where price is likely to stall (support, resistance, pivots, high-volume zones).
- Trailing stops: Lock in profits as the market moves in your favor.
- Scaling out: Reduce exposure near decision zones to secure partial gains while keeping a runner for larger moves.
A disciplined exit is what converts analysis into real profits.
5. Process Discipline & Journaling
The final but most important step is reflection. Trading is a skill built by feedback and refinement.
- Maintain a journal: Record every trade: setup, entry, exit, risk–reward, and emotional state.
- Review regularly: Spot recurring mistakes and refine your strategy.
- Focus on process over outcome: A good trade is one where you followed your plan, even if it resulted in a loss.
Journaling transforms experience into wisdom. It is the feedback loop that sharpens your edge over time.
Five Key Components of My Trading:
My trading philosophy is built on the core principle of supply and demand. Every price move is the result of imbalances between buyers and sellers, and my goal as a trader is to identify those areas of value where smart money makes decisions, retail psychology is most vulnerable, and market sentiment reveals itself most clearly.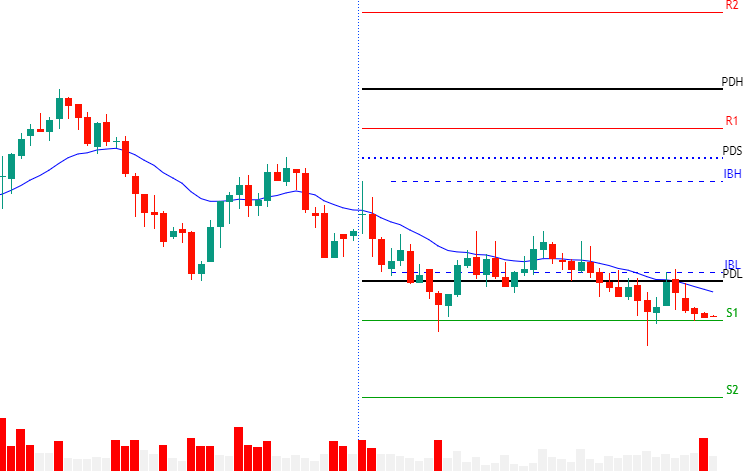
Nifty Future 10 MTF Chart with Pivots, IBH, IBL, 20EMA & Volume
Instead of relying on a traditional technical analysis, I focus only on tools and concepts that directly connect with price, volume, and net order flow. These help me stay aligned with the real drivers of the market: supply, demand, and liquidity. This approach filters out randomness, brings clarity to my thought process, and allows me to make trading decisions with structure and precision.
The five key components that shape my trading approach are:
-
- Volume Price Analysis
- Trapped Traders & Net Order Flow
- Pivot Points (CPR, PDH/PDL, PRN, PDS)
- Moving Average (Only 20EMA at 10MTF)
- Market opening & Initial Balance
I will discuss each component in short here, lets discuss one by one:
- Volume Price Analysis
Price shows direction, but volume shows conviction. Volume Price Analysis reveals where & which direction smart money is active.
Key principles of VPA:
- Principle No. 1: Volume is Relative
- Principle No. 2: Volume Precedes Price
- Principle No. 3: Technical Analysis Complements Price Volume Analysis
- Principle No. 4: Volume Either Validates or Invalidates the Price
- Principle No. 5: Volume Reveals Battle Between Supply and Demand
We have discussed earlier the role of Ultra high-volume candles and their importance.
2. Trapped Traders & Net Order Flow
Markets often move not by smooth trends but by forcing traders to take wrong positions. These trapped traders add fuel to reversals.
- False breakouts above resistance trap late buyers.
- False breakdowns below support trap shorts.
This false breakout creates the liquidity and the net order flow in the desired direction of smart money. This concept is crucial for intraday traders because most big moves are liquidity hunts before real direction.
3. Pivot Points (CPR, PDH/PDL, PRN)
If you understand pivots well, they can act as milestones on the price chart, helping you navigate the market and make informed trading decisions.
What is a Pivot?
A pivot is a specific price level on the chart where the market is in equilibrium—meaning that buyers and sellers are evenly matched. It is a neutral zone where the price can either:
- Reverse and move in the opposite direction, or
- Break through and continue its trend with strength.
So, every time price approaches a pivot, traders watch closely to see if it will hold or break.
Why Are Pivot Levels Important?
Pivots are key decision points where market participants react. They provide valuable insight into market sentiment:
- If the price is above the pivot, it suggests bullish sentiment.
- If the price is below the pivot, it suggests bearish sentiment.
Pivots often have a magnetic pull—price tends to retest these levels before making the next move.
This is why pivots are key reference points for traders. They help us determine:
- Where price might reverse
- Where a trend might be ending or beginning
- Where important buying and selling activity might take place
If we can correctly identify and use pivots, we can position our trades at the right levels and avoid unnecessary risks.
Pivot levels act as decision zones. Institutional traders often transact around them.
- CPR (Central Pivot Range): Acts as intraday magnet. Narrow CPR → trending day likely. Wide CPR → range-bound day.
- PDH/PDL: Key levels for breakout or reversal setups.
- PRN (Psychological Round Number):
4. Moving Averages (MAs)
Markets never move in straight lines. They zigzag, retrace, and consolidate before continuing in a particular direction.
- Uptrends will have red candles (down days).
- Downtrends will have green candles (up days).
This is not a sign of reversal. It is a normal and healthy part of price movement.
Making Sense of Market Chaos: The market is filled with random fluctuations, false breakouts, and noise.
Your job as a trader? Filter out the noise and focus on the real trend.
And that is exactly what Moving Averages (MAs) help you do!
What is a Moving Average?
A Moving Average (MA) is a simple yet powerful tool that helps you see the market’s true direction by calculating the average price over a set period.
Why use MAs?
Moving Averages is the most used indicator in the technical analysis. By using it properly it can align yourself in the direction of net order flow.
- They smooth out price action and cut out random fluctuations.
- They help you identify the market’s real trend.
- They prevent emotional trading by giving a structured approach.
5. Market opening & Initial Balance
The market gives us key signals right at the opening, and if we can read them correctly, we can anticipate the price action for the rest of the day.
There are two broad types of market openings:
- The opening falls within the previous day’s range
- The opening breaks out of the previous day’s range
Each type of opening tells us something different, and we need to interpret them correctly before deciding how to trade.
Daily Nifty Analysis for Tomorrow Archive
To deepen your learning and sharpen your trading edge, you can explore our archive of past Nifty Analysis for Tomorrow articles. Each analysis captures the technical outlook, key levels, and trading setups identified on that day, giving you valuable insights into how patterns develop and how strategies play out in real market conditions.
Browse the complete archive of Nifty Analysis for Tomorrow here:
Final Thoughts
Successful traders do not rely on luck however they prepare meticulously. Pre-market analysis allows you to stay ahead of price action, execute trades confidently, and manage risk effectively.
The market rewards discipline, patience, and risk management not reckless gambling.
- Stick to your plan.
- Trust your analysis.
- Respect risk management.
The traders who consistently prepare, adapt, and refine their strategies achieve long-term success in the market.
Frequently Asked Questions (FAQs)
- What is Nifty 50?
It is India stock market benchmark index, comprising the top 50 companies across sectors, listed on NSE. - How is the Nifty 50 calculated?
It is a free-float market capitalization-weighted index, meaning companies with higher market cap have greater weight. - Why is Nifty 50 considered a benchmark index?
It reflects the overall performance of India equity market and economy. - What are Nifty 50 Futures & Options?
They are derivatives contracts that allow traders to speculate on or hedge against the movement of the index. - Where can I find the list of Nifty 50 companies with weightage?
On the official NSE India website, updated periodically. - How do I read a Nifty 50 chart?
Start with higher timeframes (daily), mark key levels (PDH/PDL, CPR), check trend with MAs, and confirm moves with volume.