
History and Formation of Candlestick Charts in Trading
The use of candlestick patterns in trading dates back to 17th-century Japan, where rice traders developed early forms of technical analysis. Unlike Western charting methods, which became popular with Charles Dow around 1900, Japanese traders focused on price action to make informed trading decisions.
One of the key figures in the history of candlestick charts was Homma, a legendary rice trader from Sakata. His market observations laid the foundation for candlestick charting, which later evolved into a comprehensive tool for analyzing price trends. Although it is unclear exactly who formalized Japanese candlestick charts, their effectiveness has stood the test of time.
By the mid-19th century, Japanese candlestick charts revolutionized technical analysis by providing traders with a visual representation of market sentiment. These charts highlighted the psychological factors driving price movements, such as fear, greed, and market expectations.
Understanding Candlestick Chart Patterns for Beginners
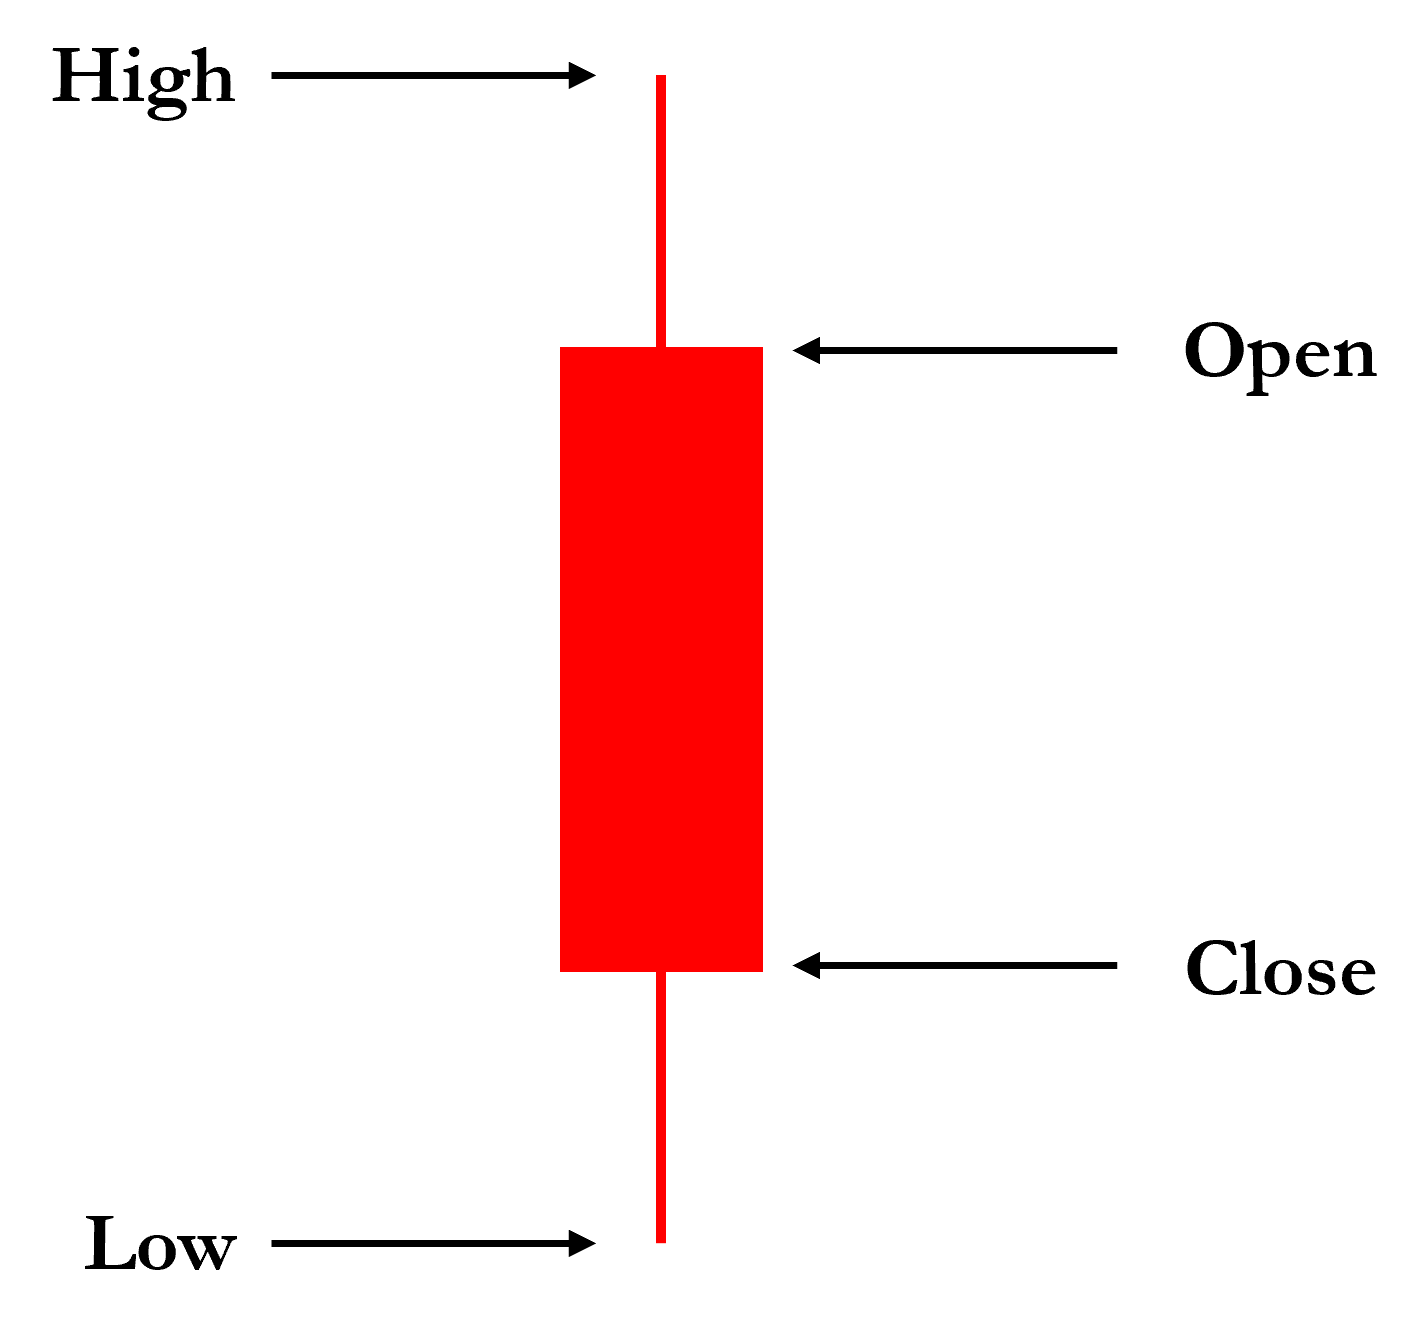
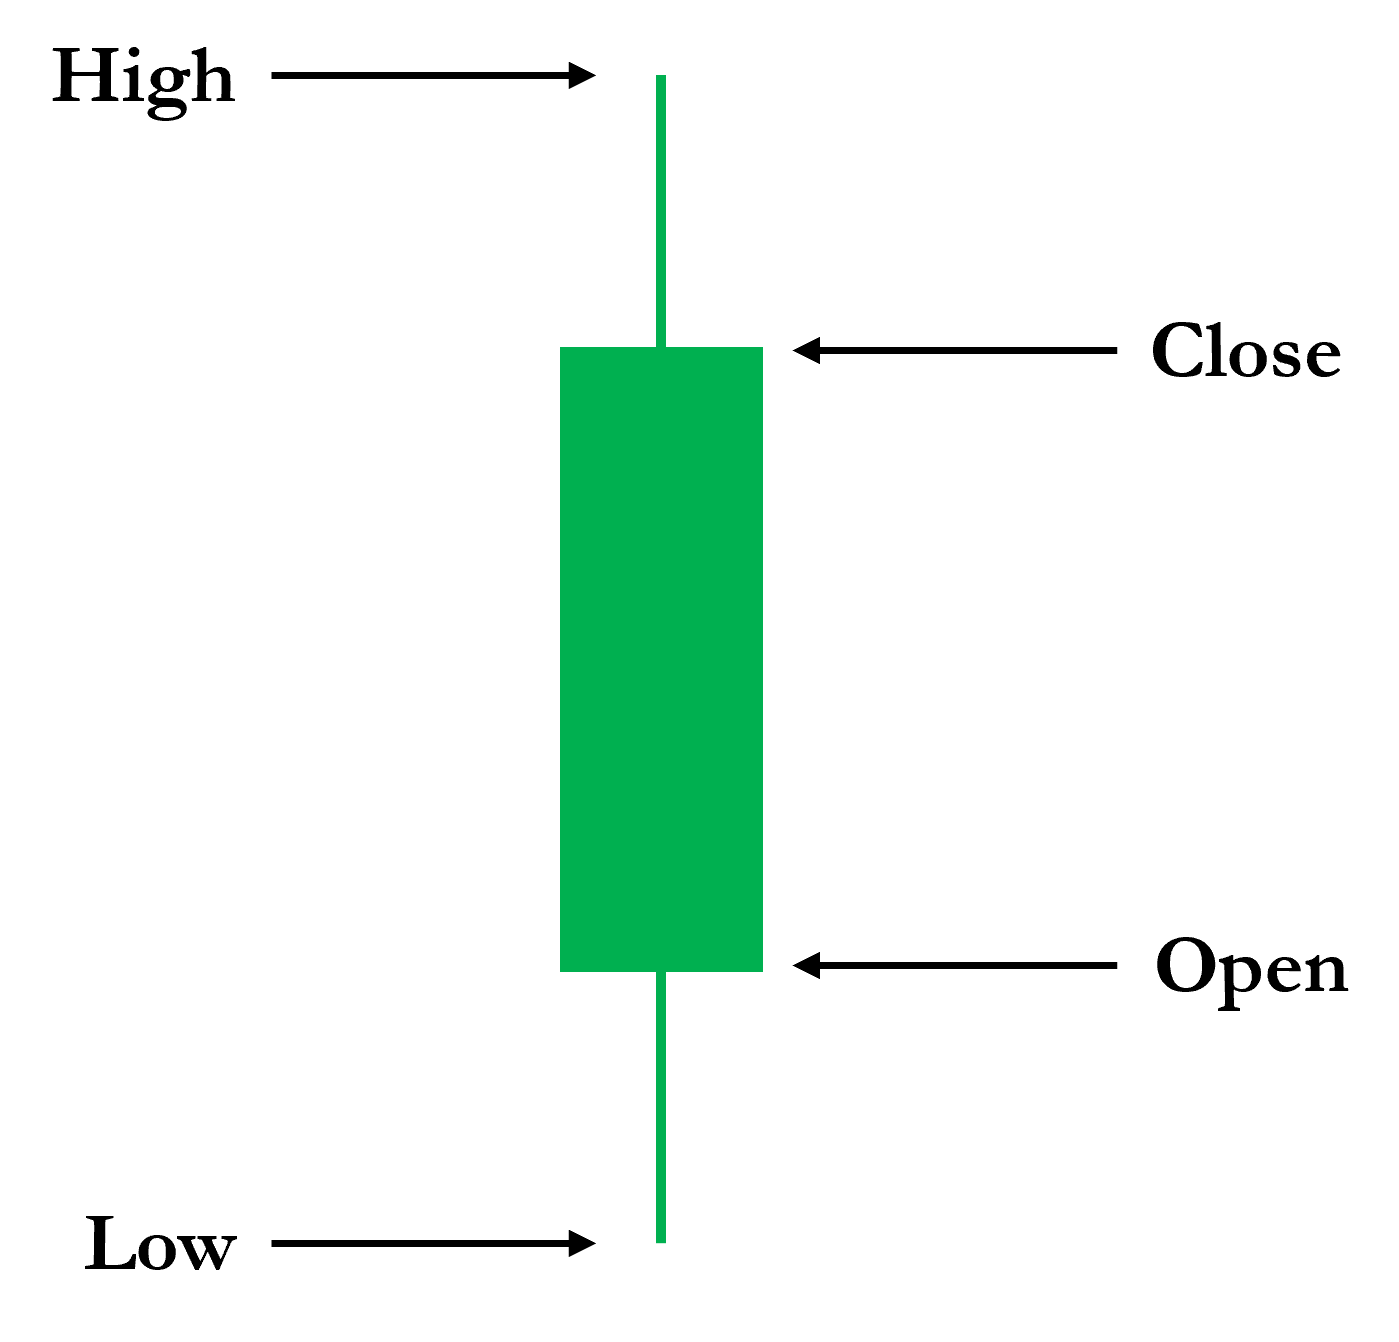
For beginners, understanding candlestick chart patterns is crucial in learning how to analyze price action effectively. Candlesticks are built using four price points:
- Open Price – The first trade price of the period.
- Close Price – The last trade price of the period.
- High Price – The highest price reached.
- Low Price – The lowest price reached.
The component of candlesticks consists of:
- The Body – Represents the difference between the open and close price.
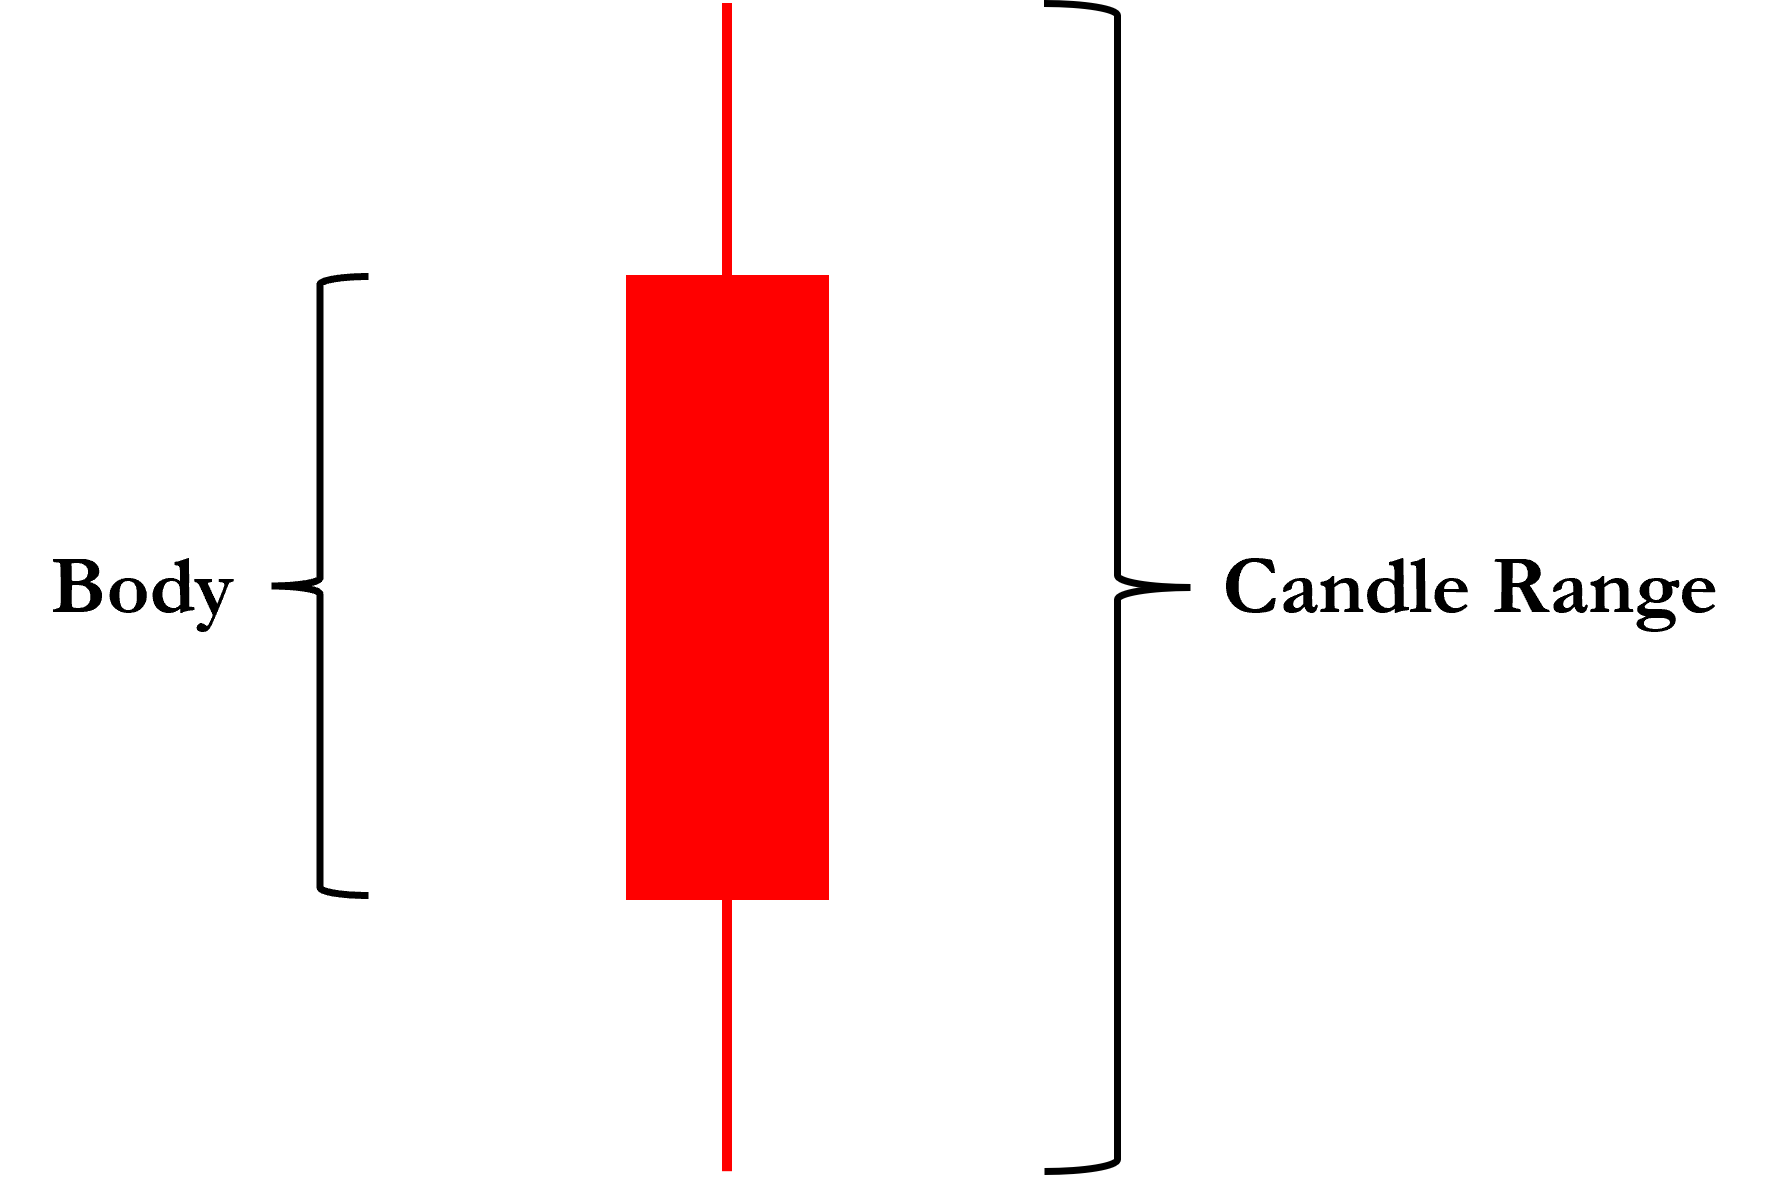
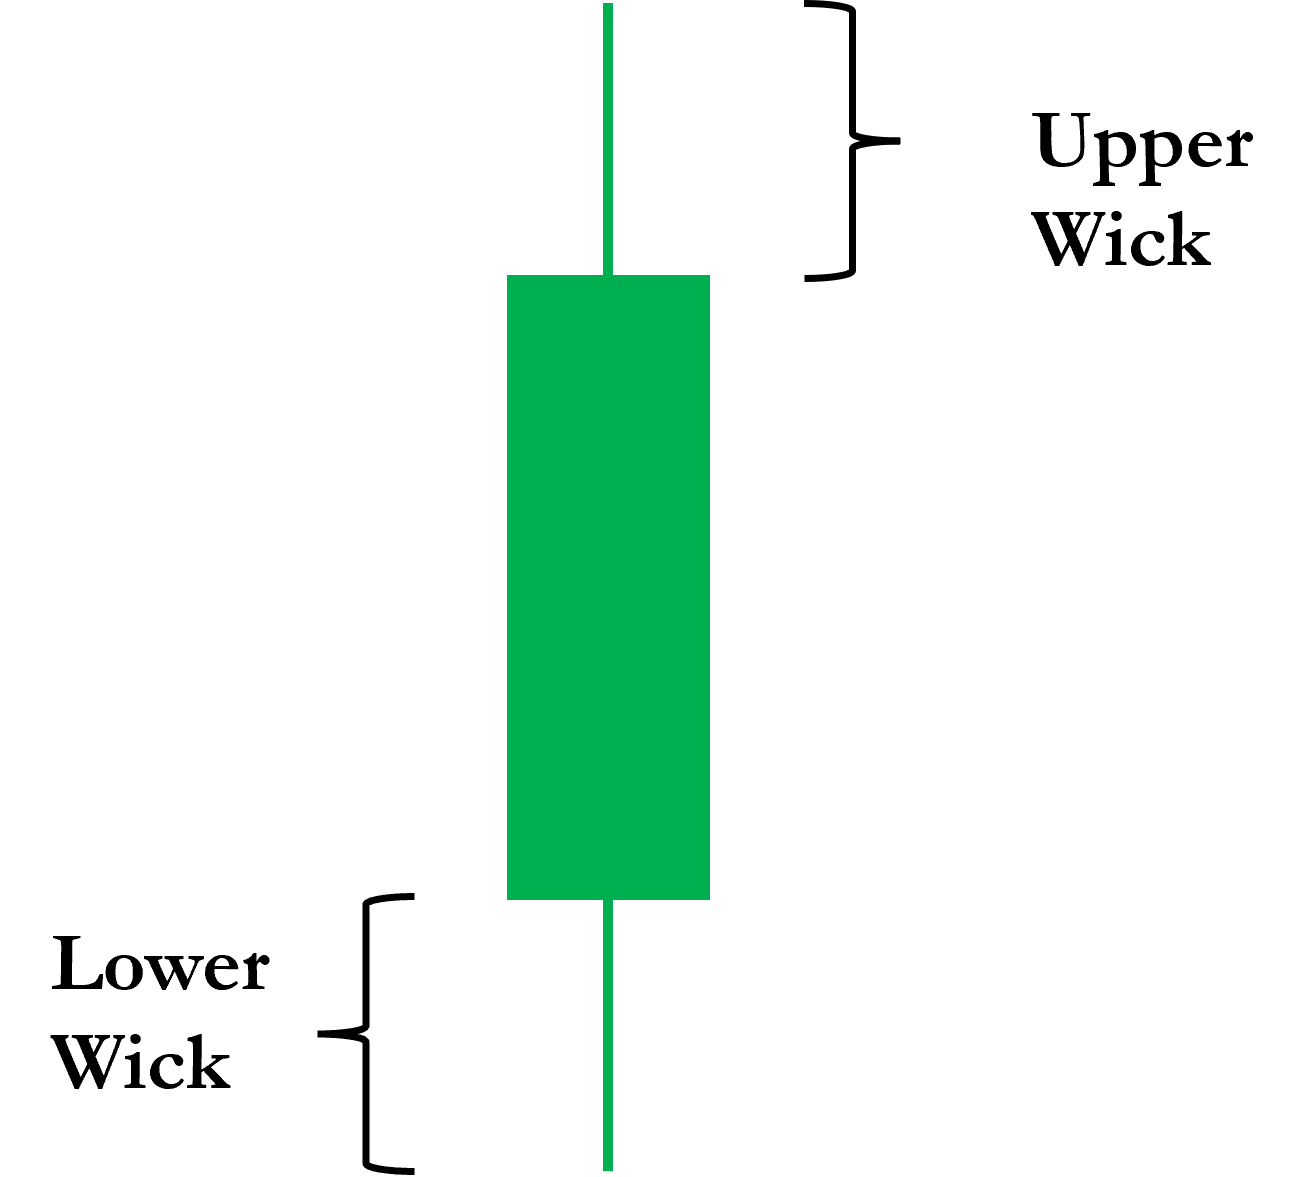
- The Shadows (Wicks/Tails) – Extend from the body, showing the high and low prices.
There are two main types of candlesticks:
- Bullish Candlestick (Green) – Forms when the close price is higher than the open price, indicating buying pressure.
- Bearish Candlestick (Red) – Forms when the close price is lower than the open price, indicating selling pressure.
By understanding candlesticks, traders can gain valuable insights into market movements and develop better trading strategies.
How Japanese Candlestick Patterns Revolutionized Technical Analysis
Traditional bar charts were commonly used in the West, but Japanese candlestick charts introduced a more intuitive way of interpreting market price action. Unlike bar charts, where traders had to analyze multiple price points separately, candlestick charts provided a clear open-close relationship along with the high-low range in a single visual format.
Here’s how Japanese candlestick charts revolutionized technical analysis:
- Enhanced Market Sentiment Analysis – The body of a candlestick (real body) immediately shows whether buying or selling pressure dominated during a trading session.
- Clear Trend Identification – Candlestick formations, such as bullish and bearish patterns, make it easier to spot reversals and continuations.
- Psychological Insights – Candlestick patterns reflect market psychology, helping traders anticipate potential price movements based on past behavior.
- Improved Decision-Making – Traders can quickly assess support and resistance levels, breakouts, and trend reversals.
These advantages made candlestick charting an essential tool for traders worldwide, influencing modern trading strategies across stocks, forex, and cryptocurrencies.
The Bottom Line
The history and formation of candlestick charts in trading show how Japanese candlestick charts revolutionized technical analysis, making price action more accessible and intuitive. For traders, especially beginners, understanding candlestick chart patterns is essential for making informed decisions and improving market predictions.
In the next section, we’ll explore how candlesticks reveal price action and market sentiment. You’ll discover why price action is only half the story— Volume tells the rest.
Let’s find out how to use candlesticks effectively in your trading strategy!
Note: This article is part of Tradonomics’ Smart Money Secrets with Volume Price Analysis series. Explore it to unlock powerful trading insights and master Volume Price Action!