
Among the many variations of the Doji candle, one stands out in the context of Volume Price Analysis (VPA): the long-legged Doji. While all Doji candles signify market indecision—with their open and close prices being the same or very close—the long-legged Doji is particularly significant due to its extended wicks on both ends.
This unique structure mirrors the erratic swings in price within a session, ultimately returning to its starting point, much like the unpredictable movements of a ‘daddy long legs’ insect. But what does this really mean for traders? Should you act on it, or is it just another candle pattern in the vast world of technical analysis?
What Does a Doji Candlestick Indicate in the Stock Market?
Price Action: A Sign of Indecision
The long-legged Doji represents a tug-of-war between buyers and sellers. Initially, the market pushes the price in one direction, only to see it sharply reverse and move in the opposite direction before settling back near the opening price. This volatility signals uncertainty—neither bulls nor bears have gained the upper hand.
To better understand this, let’s analyze a real market scenario. Below is a 15-minute chart where a perfect Doji Candlestick Pattern has formed at 10:00 hrs. This Doji, with its characteristic long wicks, captures the market’s hesitation.
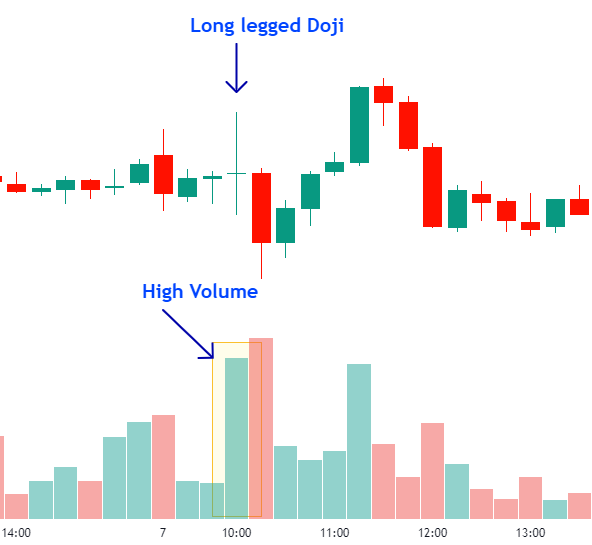
But what happens when we zoom into a lower time frame, such as the 1-minute chart? The same Doji candle now reveals its internal structure—showing the battle between buyers and sellers in greater detail.
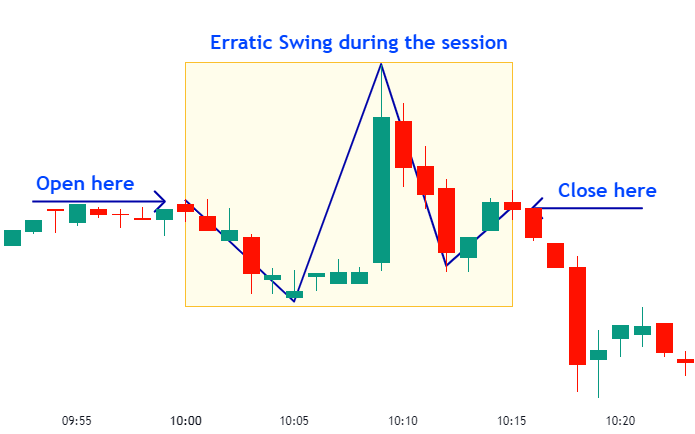
This perspective helps traders grasp the underlying price action that led to the formation of the Doji.
However, the true power of this candle lies in its predictive potential. Just like the hammer and the shooting star, the long-legged Doji often signals a potential trend reversal. If it appears after an extended uptrend, it may be the first sign of bearish momentum. Conversely, if it emerges following a prolonged downtrend, it could hint at a bullish reversal.
But spotting a Doji alone isn’t enough. To truly validate its significance, we must consider volume. A Doji forming on high or ultra-high volume strengthens its reliability, whereas a low-volume Doji may indicate market manipulation rather than a genuine shift in sentiment.
How to Use the Long-Legged Doji Candlestick Pattern in Technical Analysis
Whenever you spot a long-legged Doji candlestick pattern on charts, your next step should always be to analyze the volume behind it. A long-legged Doji candle should be accompanied by at least average volume—preferably high or ultra-high—to confirm its significance.
If volume is low, however, this is a divergence and often a sign of insider manipulation rather than a true shift in market sentiment.
But why is low volume a divergence?
Because significant price swings require effort. If the market is genuinely volatile, we should see corresponding volume surges. If not, the only logical explanation is that prices are being artificially moved—often as part of a stop-hunting strategy by market insiders. In such cases, price whipsaws up and down, targeting stop losses and triggering limit orders, but without real institutional buying or selling behind it. As traders, it’s essential to recognize these traps before acting on a false signal.
To understand this concept better, let’s analyze four different Doji candles observed in a real trading scenario:
Analysis of Long-Legged Doji in Market Trends
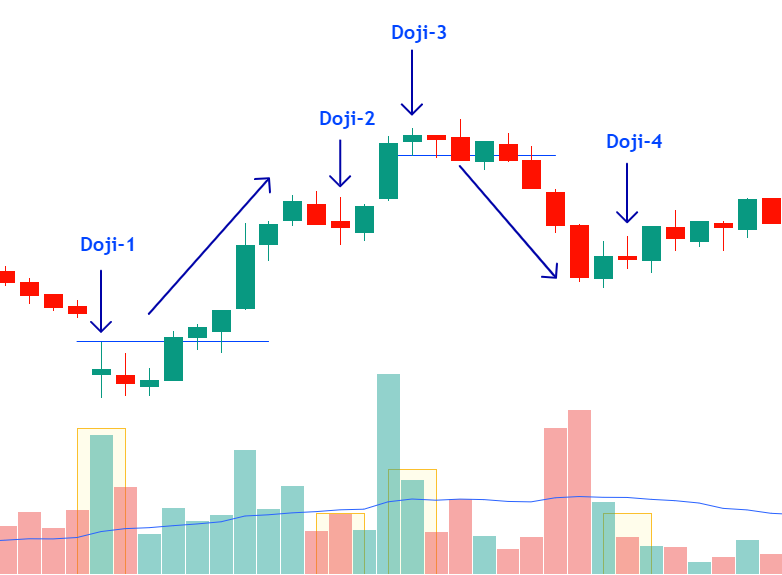
Doji-1: The Smart Money Signal
- A long-legged Doji candle forms with ultra-high volume.
- The next two candles are small Doji candles, signifying indecision.
- High volume indicates smart money participation, suggesting a shift in sentiment.
- Outcome: A prolonged uptrend follows, confirming institutional involvement.
Doji-2: A Simple Pause in the Uptrend
- A Doji candle forms, but this time with low volume.
- There’s no major shift in price action—it’s just a temporary pause.
- Outcome: The uptrend continues, as no significant buying or selling pressure exists.
Doji-3: The Reversal Signal
- Another long-legged Doji forms, but this time with ultra-high volume.
- Following this, the market shows a brief pause with small candles.
- High volume suggests smart money exiting or reversing positions.
- Outcome: A trend reversal occurs, confirming a shift in market sentiment.
Doji-4: Weak Pullback Confirmation
- A Doji forms again, but with low volume.
- Since the volume is weak, this is just a normal pullback rather than a true reversal.
- Outcome: The market experiences a minor pullback, but the overall trend remains intact.
From this example, we can derive a simple but crucial trading lesson:
- High-volume Doji candles are significant and often indicate trend shifts.
- Low-volume Doji candles are typically pauses rather than strong reversal signals.
- Always analyze volume alongside price action to avoid falling into market traps.
The Role of News Events & Market Openings
Two of the most common times to see the long-legged Doji are:
- Major News Events – For example, U.S. Non-Farm Payroll (NFP) reports, Reserve Bank of India (RBI) monetary policy announcements, Union Budget announcements, and other high-impact Geographical News events. These events often create extreme price swings, forming multiple long-legged Doji candles.
- Market Opening Sessions – The first few minutes after the market opens are typically volatile, as traders react to overnight news, pre-market moves, and institutional positioning. This volatility can frequently result in long-legged Doji formations.
However, the key question remains: Is this movement real, or is it a trap?
To determine whether the market reaction is genuine, we must analyze volume. If a price move is accompanied by strong volume, it signals institutional participation, making the move valid. However, if volume remains low, it suggests artificial price manipulation by market insiders—possibly a classic stop-hunting strategy targeting retail traders.
Key Points for Long-Legged Doji Interpretation
- The long-legged Doji signals indecision and a potential reversal.
- Volume must confirm the price action. High or ultra-high volume validates the signal, while low volume suggests insider manipulation.
- Be cautious around news events. If a price move is not supported by strong volume, it is likely a trap.
- Study volume behaviour during economic releases.
This is one of the quickest ways to understand VPA in action and differentiate real moves from false ones.
The long-legged Doji is one of the most important candles in technical analysis, but it must always be interpreted in conjunction with volume. When volume supports the price action, it can be a powerful reversal signal. When it doesn’t, it’s often nothing more than a tool for insider manipulation. By mastering this relationship, traders can make more informed and confident decisions in the market.
Note: This article is part of Tradonomics’ Smart Money Secrets with Volume Price Analysis series. Explore it to unlock powerful trading insights and master Volume Price Action!