
Have you ever looked at a chart and noticed clusters of narrow range candles? At first glance, they might seem insignificant. After all, they indicate weak market sentiment—a period where price movement is limited, and the market lacks clear direction.
So, why should you care about them?
Because hidden within these seemingly unimportant candles is a powerful clue—one that can reveal underlying strength or weakness before a major move unfolds. If you learn to read these subtle signs, you can anticipate market shifts before the majority catches on.
Understanding: The Validation vs. The Divergence
When analyzing narrow range (NR) candles, the key factor isn’t just their size but the volume behind them.
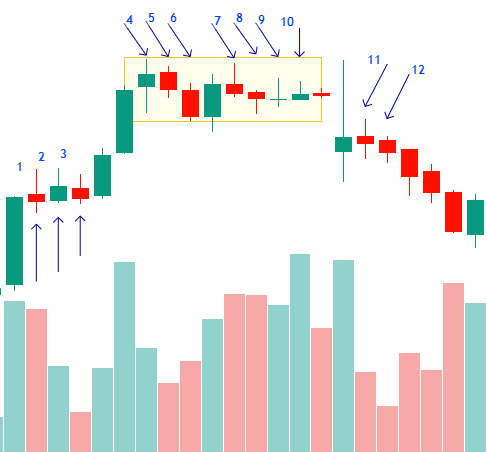
Normal Narrow Range Candles (Routine Price Action): Candles: 2, 3, 5, 6, 11, 12
- Volume: Low
- Meaning: Most of the time, narrow-range candles appear with low volume. That makes sense, right? A quiet market means low participation, leading to small price movements. These candles are routine and not particularly interesting.
- Nothing unusual—these candles are just part of normal price fluctuations.
Divergence Narrow Range Candles (Smart Money Clue): Candles: 1, 4, 7, 8, 9, 10
- Volume: Above average or high
- Meaning: Now, here’s where things get intriguing. What happens when you see a narrow range candle with above average or even high volume? That’s not normal. In fact, it’s a divergence that demands your attention.
Think with the mind of Wyckoff’s Laws: Law of Effort vs. Result – If high volume represents strong effort, we expect a strong result—a wide-range candle showing a significant move. But when there’s high volume and barely any price movement, something is off.
Why is there so much effort, yet so little result?
Let’s break it down.
What narrow range candles indicate in the stock market?
Decoding the Message: Effort vs. Result
A wide range candle with high volume makes sense—strong price movement backed by strong participation. But a narrow range candle with high volume? That’s where things get interesting.
- If it’s an up candle (closing higher) with high volume, the market is struggling. Buyers are pushing, but the price isn’t moving much. That’s a sign of weakness. Why? Because strong buyers should be able to push prices higher with ease. If they can’t, it suggests heavy selling pressure. Watch for the next candle—if it confirms weakness with a reversal pattern like a shooting star, it’s a clear warning sign.
- If it’s a down candle (closing lower) with high volume, the opposite is true. It means sellers are aggressively trying to push the price down, but someone is stepping in and absorbing that selling pressure. This could indicate hidden strength. The next few candles will give you clues—a hammer or a long-legged doji could confirm that buyers are taking control.
-
- Absorption: Institutions are actively accumulating or distributing, preventing price from moving.
- Trap Setting: Smart money might be absorbing retail orders before a big move.
- Reversal or Breakout Signal: Depending on the location (support/resistance), these candles can signal upcoming volatility.
How to use Narrow Range Candles in Technical Analysis?
- Spot the divergence. Ignore low-volume narrow candles; focus on the ones with high volume. These are the ones sending a message.
- Look for confirmation. One candle alone isn’t enough. The market speaks in sequences—pay attention to the next few candles for validation.
- Prepare for the next move. A narrow range with high volume often signals resistance or support. It’s a battleground where buyers and sellers are fighting for control. The breakout (or breakdown) is coming.
Example Scenarios
- NR Candle at Support with High Volume: Smart money absorbing selling pressure, potential reversal.
- NR Candle at Resistance with High Volume: Selling absorption, possible breakdown.
- NR Candle in an Uptrend/Downtrend with High Volume: Pause before continuation or trend reversal.
Listen to the Market’s Whisper
The market doesn’t always shout its intentions. Sometimes, it whispers. Narrow range candles with high volume are one of those whispers. They tell a story of hidden strength or weakness, of battles between buyers and sellers happening beneath the surface.
So, next time you see one, don’t just dismiss it as a random candle. Instead, lean in. Listen closely. Because when you learn to read these silent clues, you gain an edge over the market—and that’s where real trading power begins.
Note: This article is part of Tradonomics’ Smart Money Secrets with Volume Price Analysis series. Explore it to unlock powerful trading insights and master Volume Price Action!