
In trading and technical analysis, recognizing reversal patterns is crucial for identifying potential trend changes. Two of the most significant patterns are the Bullish Engulfing (discussed in the previous article) and the Bearish Engulfing Candle, which provides valuable insights into price action and market sentiment.
Now, let’s focus on the Bearish Engulfing Pattern. This pattern plays a key role in identifying Signs of Weakness after a strong uptrend and can signal a potential market downturn. Want to know how it works and why traders rely on it? Let’s break it down step by step.
What is a Bearish Engulfing Candle?
The Bearish Engulfing Pattern is a price action formation observed on two consecutive candlesticks:

- First Candle: A bullish candle, meaning the price closes higher than it opened, showing buying interest.
- Second Candle: A bearish candle that completely engulfs the body of the previous bullish candle. This pattern suggests that sellers have taken control, overwhelmed the previous bullish sentiment, and indicates strong selling pressure. This pattern often signals a trend reversal after a prolonged uptrend, especially when it appears at key resistance levels.
How to Identify a Bearish Engulfing Candlestick Pattern?
Here’s a five-point checklist to correctly identify a Bearish Engulfing Pattern:

- Look for an Uptrend – The pattern must appear after a series of higher highs and higher lows, indicating a prevailing bullish sentiment.
- First Candle (Bullish) – A small green candle that closes higher than it opened, showing that buyers are still in control.
- Second Candle (Bearish) – A large red candle that completely engulfs the previous candle’s body (open-to-close range), signaling a shift in momentum.
- Lower Closing Price – The bearish candle should close below the previous candle’s open, confirming strong selling pressure and a potential reversal.
- Higher Volume – Increased trading volume on the second candle strengthens the pattern’s reliability, indicating institutional selling.
Note: The larger the engulfing candle and the higher the volume, the stronger the reversal signal!
What is the Meaning of a Bearish Engulfing Candlestick Pattern?
The Bearish Engulfing Pattern represents a shift in market sentiment from bullish to bearish. The meaning behind this pattern includes:
- Strength of Sellers: The large bearish candle shows strong selling pressure, overpowering the previous buying momentum.
- A Sign of Weakness/Reversal Signal: If it forms after an uptrend near previous resistance, it is a Sign of Weakness (SOW). This suggests that buying interest is fading and the market may struggle to move higher.
- Increase in Supply: The first candle shows buying activity (an up candle), but when followed by a strong down candle with high volume, it indicates that demand is weakening, and supply is increasing.
- Potential Entry Point: The close of the second candle below the low of the first candle confirms that sellers are more dominant than buyers, suggesting the end of the uptrend and the beginning of a potential downtrend.
What is the Psychology of the Bearish Engulfing Pattern?
The bearish engulfing pattern isn’t just a visual formation—it reflects a psychological shift in the market. Let’s break it down:
- First Candle (Bullish Sentiment): Buyers are in control, continuing the uptrend as greed dominates. Traders enter long positions, expecting further upside.
- Second Candle (Aggressive Selling): Suddenly, sellers step in forcefully, rejecting higher prices. They overwhelm the buying pressure and drive the price downward.
- Strong Bearish Close (Market Sentiment Shift): The second candle doesn’t just erase the gains—it closes below the first candle’s low, proving that bears have taken over.
- Confirmation (The Bull Trap Effect): Now, think about those who bought during the first candle. They expected the trend to continue upward, but now they’re trapped as the price moves against them. Their losses pile up, forcing them to exit, fueling an even stronger selloff.
This shift from greed to forced selling is what makes the Bearish Engulfing Pattern one of the most powerful reversal signals in technical analysis. It’s not just about price action—it’s about how traders react under pressure.
Ultra-High Volume and Its Significance
In our previous discussions on Why Volume Matters in Trading, we highlighted how smart money leaves footprints in the form of volume. The same principle applies here—volume is a crucial factor in confirming the strength of a bearish engulfing pattern.
- Ultra-High Volume on the First Up Candle – A large green candle with high volume might seem like aggressive buying. But in many cases, smart money is actually distributing long positions while retail traders are buying. They unload their positions at high prices, preparing for a reversal.

- Ultra-High Volume on the Second Down Candle – This is where the real confirmation happens. If the second candle in the bearish engulfing pattern prints with ultra-high volume, it’s a strong sign that institutions and big players are aggressively selling. This validates the reversal and signals potential downside movement.

Volume isn’t just a supporting indicator—it’s the key to understanding market participation. When a bearish engulfing pattern is backed by ultra-high volume, it’s no longer just a simple price pattern; it’s a strong supply-driven move that can lead to significant downside momentum.
Why Does a Bearish Engulfing Candle Mark as a Strong Candle?
Ever wondered why a bearish engulfing pattern stands out as a powerful signal in the market? Let’s break it down:
- A Failed Uptrend Attempt – The first candle in the pattern represents an effort to push the market higher, but that attempt doesn’t hold. The second candle not only erases those gains but also closes near its lows, signaling a decisive shift in momentum.
- Smart Money’s Involvement – Institutions and professional traders don’t just randomly exit trades. The second candle often prints with ultra-high volume, showing that smart money is actively selling.
- A Market Reaction to Weakness – The second candle’s decline isn’t just a coincidence; it’s the market’s response to the prior bullish move. When price action aggressively reverses like this, it tells us that sellers are now in control.
- Trapped Buyers Fuel the Selloff – Now, think about the traders who bought on the first candle, expecting the uptrend to continue. Once the price closes below the first candle’s low, those buyers are trapped. Their losses start piling up, and what do they do? They rush to exit their positions, adding even more momentum to the downside.
This is why a bearish engulfing candle is more than just a reversal pattern—it’s a sign that supply is overpowering demand, and the price may be setting up for a strong move lower.
Bearish Engulfing Candle High as Resistance
Have you ever noticed how a bearish engulfing candle can set the stage for a strong downward move?
When a bearish engulfing pattern forms, the high of the second candle isn’t just a random level—it’s where sellers stepped in with conviction, completely overpowering the previous bullish sentiment. The price closes below the previous candle’s low, confirming the shift in momentum. That high? It’s now a key resistance zone, and traders often place their stop-loss orders there.
But here’s where it gets interesting. Ever wondered why price sometimes retests that level? That’s smart money at play. They might push the price up with low volume, triggering stop-losses, grabbing liquidity, and filling their short positions before driving the next leg lower. If the price then closes below the first candle’s low, it’s a strong signal—one that presents a high-probability entry for a short position.
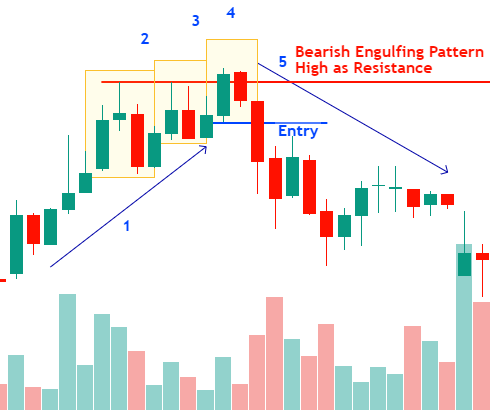
Let’s walk through this example step by step and see how smart money tricks retail traders into a fake breakout before making their actual move.
Candle-1: The Bearish Engulfing in an Uptrend
The market is in a strong uptrend with no major resistance nearby. Everything looks bullish. But suddenly, a bearish engulfing candle appears, completely swallowing the previous bullish candle. This is a strong sign that sellers are stepping in. But is it enough to short? Not yet.
Candle-2: The Bearish Engulfing Candle High as Resistance
Now, the high of this bearish engulfing candle becomes an important level. Why? Because this is where sellers took control. If the price retraces back to this level, we need to watch how it reacts.
At this point, another bearish engulfing candle forms, but there’s something off—it happens on low volume. Should we short here? No. Here’s why:
-
If sellers were really strong, volume should be high. Weak volume suggests a lack of aggressive selling.
-
There are no trapped positions yet. A real reversal often comes after traders get trapped to create net order flow in the wrong direction.
Candle-3: The Fake Breakout Trap
The price starts creeping back toward the resistance level, but notice how it’s doing so on low volume? That’s a clue—there’s no strong selling pressure.
Then, suddenly, a breakout above the resistance happens on high volume. This is where retail traders panic and start buying, thinking the market is going higher. But is it a real breakout? Let’s wait and see.
Candle-4: Smart Money Strikes
Here’s the key moment—right after the breakout, the price reverses sharply. This is smart money absorbing liquidity from trapped buyers. The price then closes back below the breakout candle’s low, completely invalidating the bullish move.
This is classic manipulation. Retail traders get caught buying at the top, only to see the market reverse against them.
Candle-5: The Downtrend Begins
Now, with buyers trapped and forced to sell, the price starts a strong downtrend. This is how smart money plays the game—they create a fake breakout, lure traders in, and then drive the market in the opposite direction.
Next time you see a bearish engulfing candle, keep an eye on that high. It might just be the perfect place to position yourself ahead of the big players.
Is the Bearish Engulfing Pattern Reliable?
If you’ve analyzed charts, you’ve probably seen plenty of bearish engulfing patterns—and even more when zooming into lower time frames. But not all of them lead to strong reversals. So, how do you filter out the high-probability setups from the weaker ones?
Higher Reliability Factors:
- Occurs after a strong uptrend – The longer and steeper the trend, the more likely the reversal is meaningful.
- Forms at key resistance levels or moving averages – A bearish engulfing candle rejecting a strong resistance zone increases its significance.
- High trading volume – If the second candle prints with ultra-high volume, it confirms strong selling interest from institutional traders.
- Appears on higher time frames – For day traders, a 5-minute or 15-minute bearish engulfing pattern is more reliable than one on a 1-minute chart.
Lower Reliability Factors:
- Forms in a choppy or sideways market – When price action lacks a clear trend, engulfing patterns are more likely to be false signals.
- Low volume on the second candle – If the pattern lacks strong selling volume, the reversal might not hold.
- No confirmation from follow-up candles – If price fails to continue downward after the engulfing pattern, the setup loses credibility.
- Appears on very low time frames (1-min, 3-min) – These time frames have more noise, making patterns less reliable for day traders.
A bearish engulfing pattern is powerful, but context matters. When combined with key resistance levels, high volume, and confirmation from subsequent candles, it can signal a high-probability trade.
What is a Bearish Engulfing Candle Trading Strategy?
The Bearish Engulfing pattern is one of my go-to techniques for precise trade entries and stop-loss placement. When used correctly, it helps traders enter high-probability trades while managing risk efficiently.
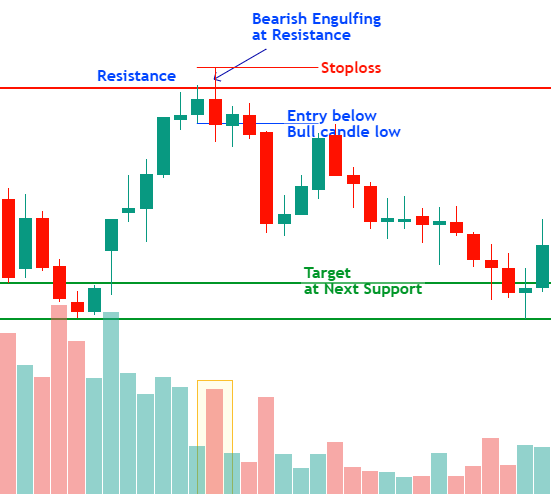
Step-by-Step Trading Strategy:
- Entry Point: Enter a short position after the bearish engulfing pattern is confirmed. The ideal entry is when the engulfing candle closes below the previous candle’s low.
- Stop Loss Placement: To minimize risk, place a stop loss above the high of the engulfing candle. This ensures that if the market moves against you, losses are controlled.
- Profit Target: Set a take-profit target at the next support level or follow a risk-reward ratio of at least 1:2 for better trade management.
- Position Exit: If you are in a long position and a bearish engulfing candle form, this is a warning sign. If price action confirms a reversal, it’s wise to exit your long position and avoid unnecessary losses.
This strategy helps traders capitalize on bearish reversals while maintaining strong risk management. By combining the pattern with key resistance levels and volume confirmation, traders can significantly increase their win rate.
The best engulfing pattern?
One question might be on your mind: Which engulfing pattern is stronger—Bullish or Bearish? We’ve discussed both, but the answer lies in trading psychology and is directly linked to the phrase, “You cannot survive in day trading without big profits.”
The stronger engulfing pattern is the one that leads to bigger profits, making it crucial for traders seeking long-term success. Curious to know more? We’ll dive deep into this in our Trading Psychology article series. Stay tuned!
Key Takeaways and Actionable Insights:
- Bearish Engulfing Pattern highlights significant trend changes and Signs of Weakness.
- A Bearish Engulfing Pattern at resistance indicates that the uptrend might be coming to an end, especially if the second candle has high volume and closes near its lows.
- Always look for confirmation after spotting these patterns, such as a No Demand signal or further price action near the low of the second candle.
- Ultra-High Volume plays a crucial role in confirming the validity of the reversal.
- The effort vs. result principle matters—if the first candle’s high volume shows strength, but the second candle drops strongly, it signals genuine supply and potential price depreciation.
By understanding and applying these insights, traders can better anticipate market reversals and increase their trading accuracy. Let price action and volume be your guide!
Note: This article is part of Tradonomics’ Smart Money Secrets with Volume Price Analysis series. Explore it to unlock powerful trading insights and master Volume Price Action!