
You may have heard a lot about Selling Climax or Buying Climax in Technical Analysis, but What is meant by a climax?
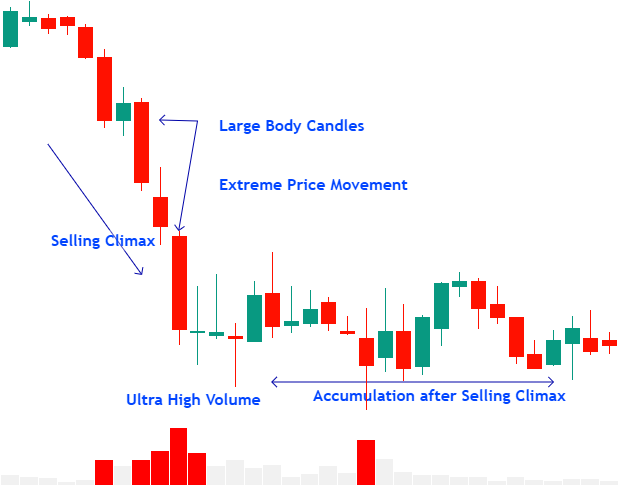
A Climax occurs when ultra-high volume, wide range candles, and extreme price movement happen together, indicating that the current trend is reaching an unsustainable peak or trough, likely followed by a pause, reversal, or consolidation.
How to Identify a Climax in Trading:
A Climax is identified by a combination of:
-
- Ultra-high volume
- Wide range candles
- Extreme price movement
- Ultra-High Volume
During a climax, there is unusually high volume, indicating that a large number of market participants are involved.
-
- This high volume confirms the significance of the price move.
- It reflects strong participation from both retail and institutional traders.
- Such extreme volume highlights that the market is reaching an unsustainable level of activity.
- Wide Range Candles
A climax is often represented by wide range candles.
-
- These large candles reflect strong momentum and extreme price movement in a short time.
- The large body indicates aggressive buying or selling pressure.
- In the context of a climax, it signals an unsustainable surge in market activity.
- Wide range candles serve as clear visual indicators that the market is at an extreme point and may soon pause, reverse, or consolidate.
- Extreme Price Movement
A climax is typically accompanied by a sharp and sudden price movement far beyond recent support, resistance, or trend levels.
-
- The price rapidly moves up or down in a short period of time.
- This extreme movement is often too fast to be sustained, signalling potential exhaustion of the current trend.
- After the climax, price action often slows down, stalls, or reverses.
Type of Climax in Trading
A Climax reflects an extreme point of market activity where price and volume surge to unsustainable levels. However, it is important to understand who is doing what in the market:
-
- The public tends to act emotionally, often buying at market tops and selling at market bottoms.
- The smart money act strategically, accumulating or distributing positions.
Buying Climax (Public Perspective)
A Buying Climax appears as a large green (bullish) candle with a big body and unusually high volume.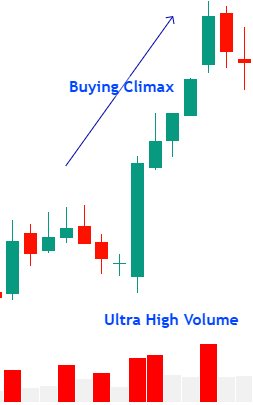
-
- The public sees it as a strong surge of buying, with many traders entering positions, expecting the price to continue rising.
- It typically occurs near the top of a bullish trend and signals that the market is overbought.
- After a buying climax, the price often stalls, reverses, or enters consolidation, as the buying pressure becomes unsustainable.
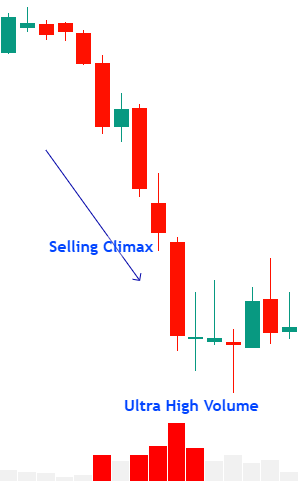
Selling Climax (Public Perspective)
A Selling Climax appears as a large red (bearish) candle with a big body and extremely high volume.
-
- From the public’s point of view, it looks like panic selling, where many traders are aggressively exiting positions in fear of further losses.
- This usually happens near the bottom of a bearish trend and signals that the market is oversold.
- After a selling climax, the price often slows down, reverses, or starts to consolidate, as selling pressure exhausts and insiders may begin accumulating.
What is the difference between buying climax and selling climax?
| Aspect | Buying Climax | Selling Climax |
| Definition | A Buying Climax occurs when there is an extreme surge in buying activity at the top of an uptrend, often leading to a trend reversal or consolidation. | A Selling Climax occurs when there is an extreme surge in selling activity at the bottom of a downtrend, often leading to a trend reversal or consolidation. |
| Market Phase | Occurs after a bullish trend, signalling the market may be overbought. | Occurs after a bearish trend, signalling the market may be oversold. |
| Public Action | Public traders aggressively buy, expecting the price to rise further. | Public traders panic sell, fearing further losses. |
| Insider Action | Smart Money start distributing (selling) their positions to weaker hands. | Smart Money begins accumulating (buying) at low prices as weak holders exit. |
| Visual Signal | Large green (bullish) candlestick with ultra-high volume. | Large red (bearish) candlestick with ultra-high volume. |
| Implication | Buying pressure becomes unsustainable, often followed by a slowdown, consolidation, or price reversal downward. | Selling pressure becomes unsustainable, often followed by a slowdown, consolidation, or price reversal upward. |
| Key Insight | Signals a potential top and distribution phase. | Signals a potential bottom and accumulation phase. |
Till now, you are staying with me, that’s great.
We have discussed what is a Climax is and its two types from the public points of view.
Next, let’s focus in detail on the Selling Climax.
What Is Selling Climax
It represents a turning point in a downtrend where extreme panic selling marks the exhaustion of bearish pressure, creating conditions for a potential reversal. The Selling Climax (SC) is a critical concept in Technical Analysis and Volume Price Analysis.
For traders and investors, recognizing the Selling Climax can be the difference between selling at the bottom in panic or positioning themselves alongside Smart Money for the next bullish move.
Selling Climax Definition
-
- A Selling Climax occurs after an extended period of falling prices in a bear market.
- It represents a point where the majority of traders or investors, known as the “Herd,” can no longer endure the losses and sell their holdings to avoid further pain.
- This mass selling, combined with very negative news, drives prices lower, making them attractive to Smart Money buyers.
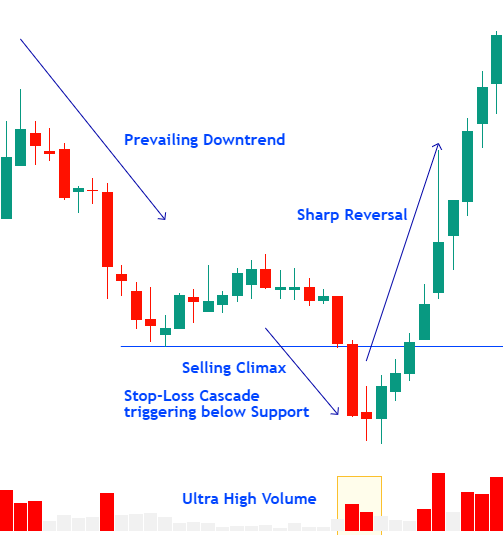
- Stop-Loss Cascade – As support levels break, stop-loss orders get triggered, accelerating the downward momentum.
In short, the Selling Climax is the transfer of ownership of stock or assets. Weak holders (those driven by fear and panic) sell in panic and Smart Money who recognize value at low levels accumulates quietly.
Selling Climax Characteristics
A true Selling Climax has several identifiable features:
-
- Wide Spread Candles: The price moves sharply lower within the session, creating long bearish candles.
- Ultra-High Volume: Selling pressure is accompanied by exceptionally high trading volume, showing panic-driven liquidation.
- Bearish News: Negative events drive the fear. The setup becomes even more bullish if the market closes strong despite bad news, proving that professionals are buying heavily.
This combination of wide price candles, ultra-high volume, and negative sentiment forms the classic footprint of a Selling Climax.
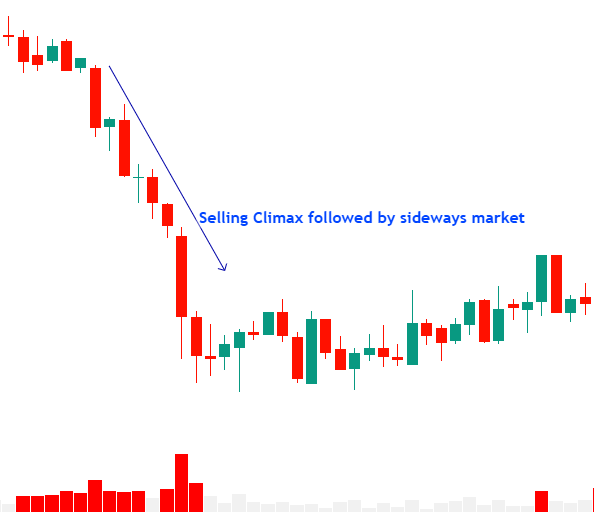
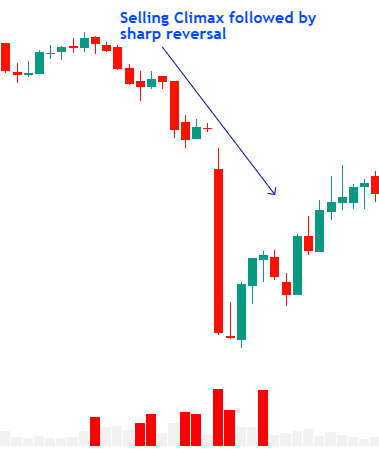
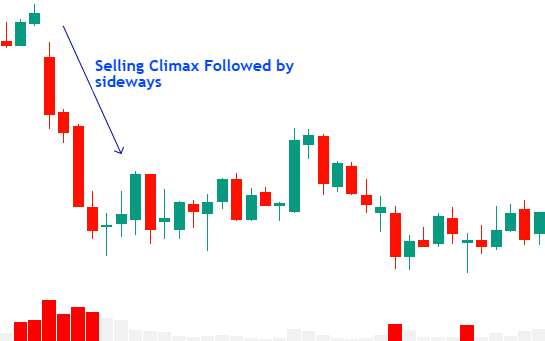
Selling Climax Example
The Role of News in a Selling Climax
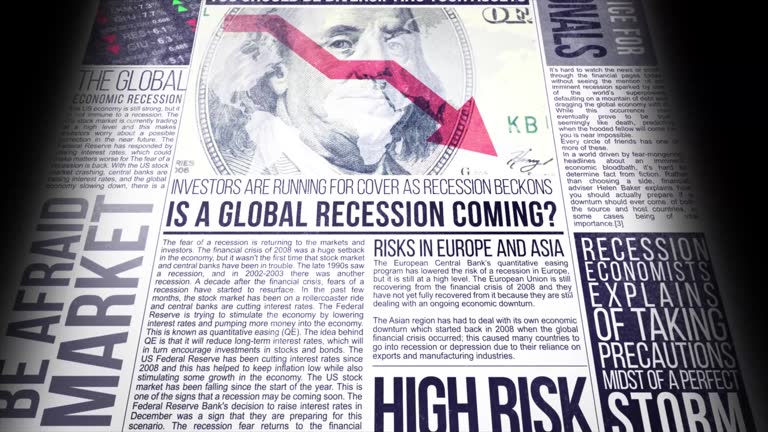
During a Selling Climax, news plays a significant but often misleading role, especially for retail traders and the general public. As prices plummet sharply with ultra-high volume and large bearish candles, media outlets tend to publish sensational and alarmist headlines that amplify fear and pessimism.
You might see headlines like:
- “Market Crash Worsens: Experts Warn of Deeper Losses”
- “Stocks Plunge to New Lows Amid Economic Collapse Fears”
- “Mass Sell-off as Investors Panic Over Economic Uncertainty”
How This Affects the Public
Analysts also issue aggressive stock downgrades or bearish predictions, reinforcing a sense of doom.
This affects the public profoundly. Retail traders and weak holders, driven by fear, panic sell their positions, triggering cascades of stop-loss orders. As a result, the price decline accelerates further, and the public becomes convinced the market will keep falling, acting emotionally rather than strategically.
Why Charts Are More Trustworthy Than Headlines
However, charts are far more trustworthy than headlines. While news often reacts after events occur and exaggerates worst-case scenarios, price charts reveal the real-time behavior of supply and demand.
Key signals of a Selling Climax include:
- Ultra-high volume bars during sharp down moves
- Wide range bearish candlesticks
- A strong close despite negative news → signaling professional buying
For example, when a large red candle forms on huge volume but closes near the high of the session, it suggests Smart Money is quietly absorbing supply, irrespective of negative news.
Professional Traders’ Mindset
Professional traders understand that extreme pessimism often signals a market bottom. They stay patient, watching for confirmation signals such as lower volume on subsequent down days, price stabilization, or lack of follow-through downward.
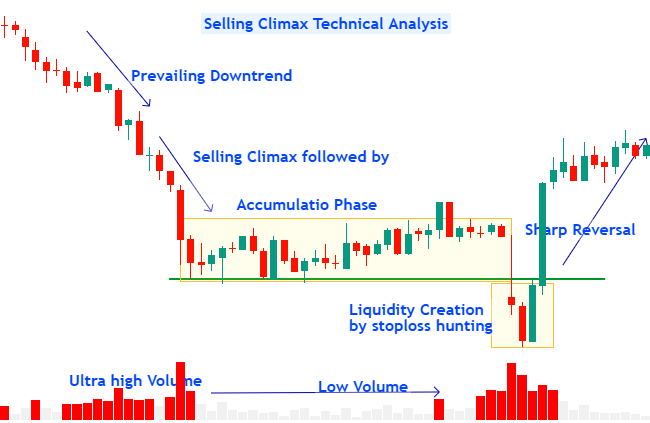
Selling Climax Technical Analysis
A Selling Climax suggests the end of a downtrend, with the market having reached an extreme low point. Sellers are exhausted, and every weak hand that wanted out has already sold. At this point, buying interest begins to increase at attractive low prices.
 Key interpretation points:
- When you see ultra-high volume during a down move, it often signals Smart Money stepping in.
- If subsequent sessions show low volume narrow range candles with little downside progress, it means the professionals are absorbing supply quietly.
- This often marks the beginning of a reversal phase as accumulation builds strength.
Low Volume After the Event
After a Selling Climax, the most bullish confirmation is low volume without further price declines.
- If prices stop falling despite low volume, it suggests that selling pressure has been absorbed.
- Professional traders are now accumulating, taking the other side of panic-driven selling.
- The lack of follow-through to the downside signals the market is ready for a reversal.
This period can be frustrating for retail traders who expect immediate rebounds. However, it is in this quiet phase where Smart Money patiently builds positions before driving the market higher.
The Behavior of Market Participants
- Weak Holders vs. Smart Money
-
- Weak Holders: Traders and investors who bought at higher prices and are now trapped in losses. Their fear and emotional decision-making cause them to exit at the worst possible moment, typically during a Selling Climax.
- Smart Money: Experienced investors who recognize that extreme pessimism often creates undervaluation. They take the opportunity to accumulate at bargain prices.
- Transition from Weak to Strong Holders
At key price levels during a Selling Climax, there’s a clear transfer of shares:
-
- Weak holders sell in panic.
- Smart Money accumulates quietly.
- Over time, this accumulation forms a base for the next uptrend.
This transition is a cornerstone of Wyckoff Accumulation Phase. Charts reveal this shift through ultra-high volume down bars followed by stabilization and lack of downside progress.
Market Behavior and the Role of Accumulation
Accumulation is the process through which Smart Money builds positions after panic selling. If professionals are absorbing shares during the climax, the market will often test lows multiple times to ensure all weak hands are shaken out.
Once accumulation is sufficient:
-
- Downward pressure diminishes.
- Prices stabilize in a range.
- A bullish breakout can eventually follow.
This explains why Selling Climaxes are often followed by trading ranges or bases before the next leg higher.
The Role of Liquidity
During a Selling Climax, stop hunting plays a key role in liquidity creation. Smart Money pushes prices below support levels to trigger stop-loss orders from retail traders, creating significant liquidity.
This process helps flush out weak hands and provides the volume needed for large players to accumulate positions without sharply moving prices. In illiquid markets, stops are hunted by driving prices well below support, while in liquid markets, aggressive moves trigger stops.
What appears as panic selling is often a strategic move by professionals to create liquidity before accumulating and reversing the trend.
Now, let me answer the most important question you may be wondering: How can you effectively use a Selling Climax in Intraday Trading?
How to Use Selling Climax in Intraday Trading
No matter the timeframe, a Selling Climax (SC) can appear in every market, on every timeframe, and across all assets. It is one of the most powerful signals that helps intraday traders make informed decisions at critical market turning points.
Below are the three key strategies that I personally apply to use the Selling Climax effectively in intraday trading:
-
Exit Existing Short Positions Using Selling Climax
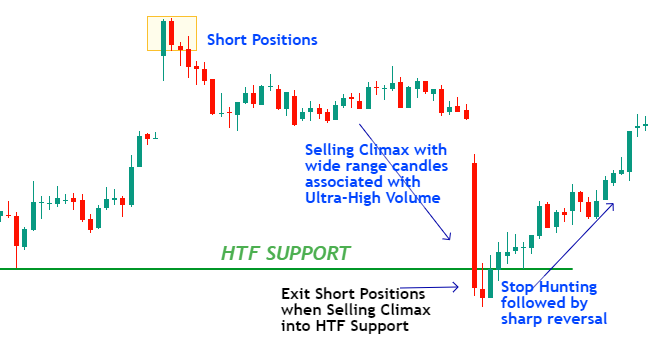
Notice how the price was in a strong downtrend, then suddenly a large red candlestick appears with ultra-high volume – a clear Selling Climax. Panic selling peaks as retail traders rush to exit, triggering a cascade of stop-loss orders, while the extreme volume indicates most weak hands have already sold.
As the price approaches a higher timeframe (HTF) support level, this signals that the downtrend is likely exhausting. Smart traders use this opportunity to exit short positions and prepare for potential long entries, avoiding being caught in a sharp reversal or accumulation phase that follows.
Observe how, after the climax bar, the price briefly breaks below support but quickly reverses, followed by a strong upward movement.
-
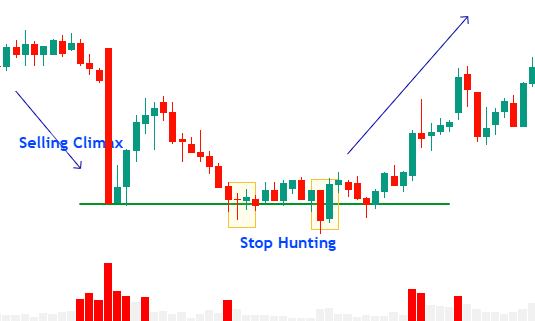
Build New Positions Near Climatic Support with False Breakouts
-
- Pay attention when the price approaches to significant support levels climatically (with extreme moves and high volume).
- A false breakout often occurs: The price pierces support briefly on high volume but quickly recovers, as Smart Money absorbs the selling pressure by building long positions.
- This creates an ideal opportunity to build new long positions in anticipation of a market reversal.
- Look for strong confirmation signal:
- Price rejects the lower level and closes back above the support.
- Volume decreases after the climax.
- Price shows signs of stabilization.
- Following this strategy positions you to ride the next up-move with a higher probability of success.
-
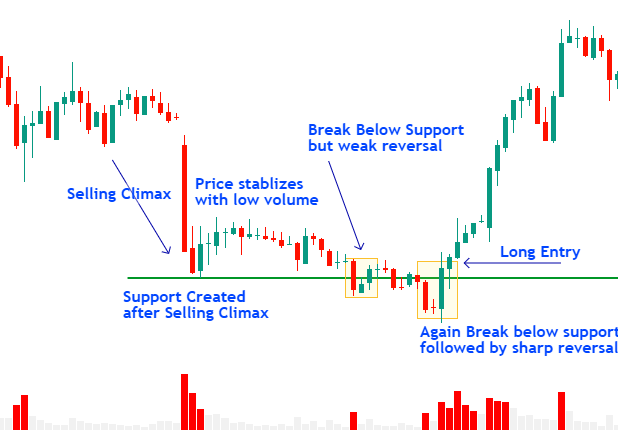
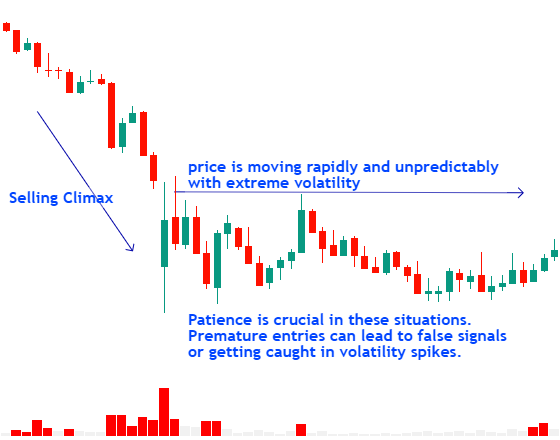
Be Watchful and Stay Sideways During Climatic Price Moves
-
- During a Selling Climax, prices often move rapidly and unpredictably with extreme volatility.
- When you neither have long nor short positions then Instead of trying to catch the extreme moves immediately, it is better to stay on the sidelines and observe price action.
- Look for key signs of potential trend exhaustion:
- Does the price begin to slow down?
- Are subsequent candlesticks smaller in body and volume declining?
- Is price consolidating near support after the climax?
- Patience is crucial in these situations. Premature entries can lead to false signals or getting caught in volatility spikes.
- Wait for clear evidence of trend exhaustion and accumulation before entering new positions.
Key Takeaways for Traders
- Trust the Chart, Not the News
-
- Charts reveal the real behavior of supply and demand.
- News amplifies fear or greed but often lags behind price action.
- Use tools like Volume Price Analysis to spot the footprints of Smart Money.
- Recognize and Act on a Selling Climax
-
- Watch for ultra-high volume and extreme panic selling.
- Confirm with subsequent low-volume down days showing lack of follow-through.
- Enter positions strategically, aligning with Smart Money rather than retail panic.
- Be Patient and Disciplined
-
- Emotional reactions to news can destroy trading accounts.
- A properly analysed chart provides the discipline needed to hold positions.
- Patience is key: Selling Climaxes often take time to fully play out before major reversals begin.
Final Thoughts
The Selling Climax is one of the most powerful signals in market analysis.
It highlights the exact moment when fear peaks, weak hands capitulate, and Smart Money takes control.
By studying:
- Charts,
- Volume patterns, and
- Market psychology,
Traders can learn to spot these climaxes and trade alongside the professionals.
Understanding this concept requires:
- Discipline,
- Patience, and
- Trust in chart-based evidence rather than sensational news headlines.
When applied correctly, identifying a Selling Climax can allow you to enter at or near major market bottoms, positioning yourself for the next powerful uptrend.
By mastering the art of recognizing a Selling Climax, you align your strategies with Smart Money and gain the confidence to act when others are fearful.
Note: This article is part of Tradonomics’ Smart Money Secrets with Volume Price Analysis series. Explore it to unlock powerful trading insights and master Volume Price Action!