
At first glance, an Inverted Hammer Candlestick might seem like a sign of weakness. After all, it has a small body near the bottom of the range and a long upper wick—similar to a Shooting Star. But here’s the key difference: context.
A Shooting Star forms at the top of an uptrend, signaling potential bearish reversal. An Inverted Hammer, on the other hand, appears after a downtrend, and that makes all the difference. Instead of weakness, it’s flashing a potential shift from bearish to bullish momentum. 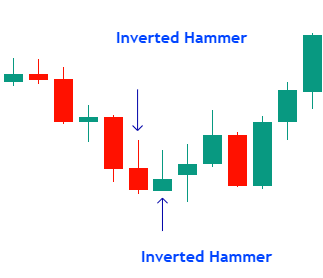
Let’s dive deep into what the Inverted Hammer tells us and how you can use it to stay ahead of the market.
What Does an Inverted Hammer Candlestick Indicate in the Stock Market?
Price Action: A Warning Sign in a Bearish Trend
Imagine you’re tracking a stock that has been steadily declining. Bears are in control, pushing the price lower, and sentiment is negative.
Then, one day, something interesting happens:
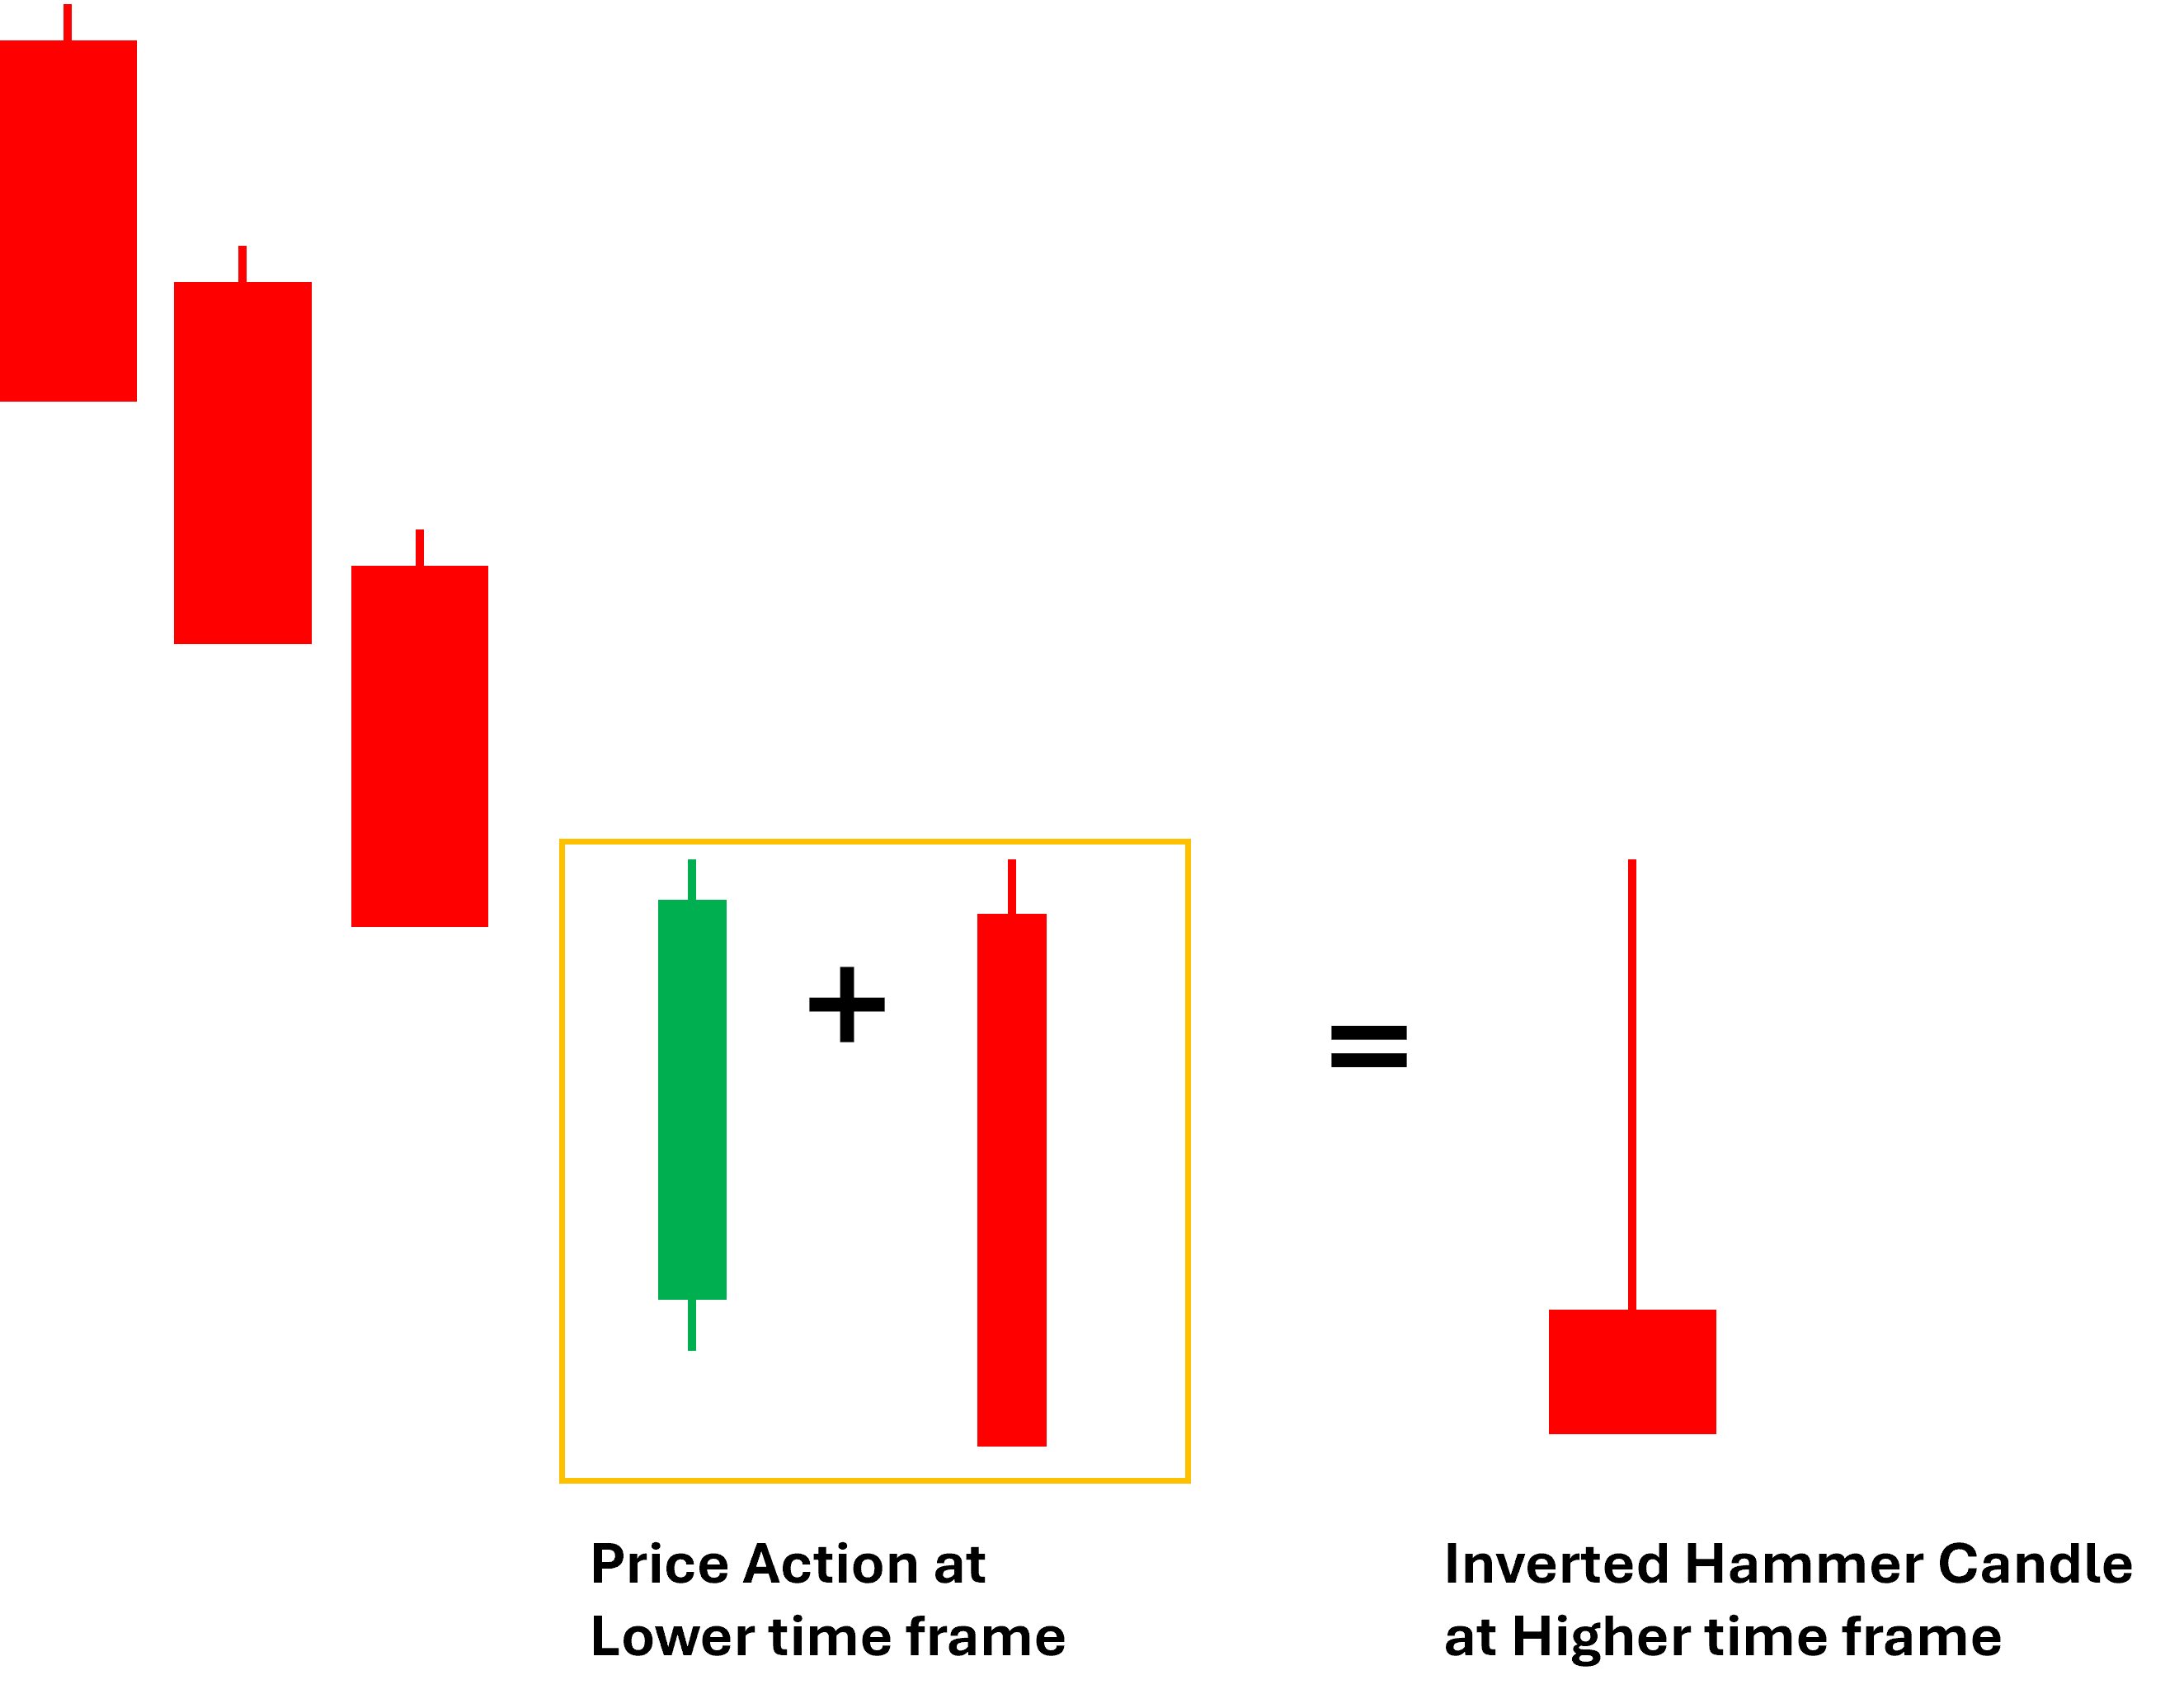
The price initially surges during the session but eventually closes near the open, leaving behind a long upper wick.
At first glance, you might think:
“Okay, sellers stepped in and pushed the price back down—nothing to be excited about, right?”
But look closer. This sudden attempt by buyers to push prices higher signals that demand is creeping back in. Even though sellers managed to regain control by the close, the appearance of buying pressure at the end of a downtrend is the first sign that bearish momentum might be running out of steam.
Now, the question is: How do you confirm if this is just a temporary bounce or the start of a real trend reversal?
Inverted Hammer candlestick pattern in technical analysis
Volume: The Key to Inverted Hammer Reversal Confirmation
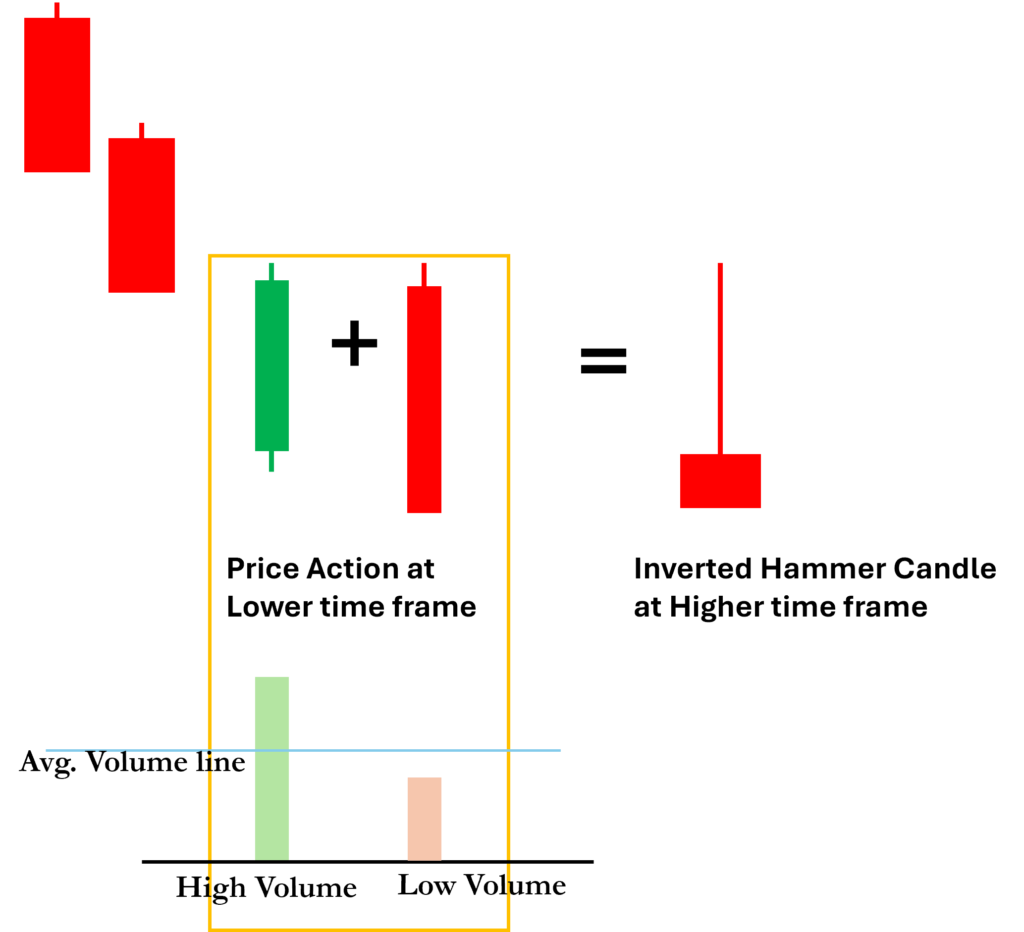
When you observe price action of Inverted Hammer Candlestick with Volume Price Analysis: Buyers to push prices higher with high volume signals that demand from smart money is creeping back in either they are offloading their short positions or making long positions. Even though sellers with low volume managed to regain control by the close, the appearance of buying pressure at the end of a downtrend is the first sign that bearish momentum might be running out of steam. That means this is a first strong warning sign for presence of buyers in prevailing downtrend.
So, If you want to understand the significance of an Inverted Hammer, volume is your best ally.
- An Inverted Hammer with low volume? Likely just noise—something to note but not necessarily act on.
- An Inverted Hammer with above average or high volume? Now that’s significant.
Why does volume matter? Because high volume signals the presence of smart money—the institutional players, insiders, and professional traders who shape the market. If they are stepping in at the end of a downtrend, this Inverted Hammer could be the first footprint before a major price reversal.
So, what do you do when you see a high-volume Inverted Hammer? You watch closely. But don’t act just yet—wait for confirmation.
How to Confirm an Inverted Hammer Candlestick Reversal?
An Inverted Hammer is an early warning sign, not a standalone buy signal. It needs validation from subsequent price action. Acting on it alone would be like seeing a sunrise and assuming the day will be warm—it’s a clue, not a certainty.
The Best Confirmation?
A Bullish Engulfing or Hammer candle forming within the next few sessions.

Why? Because a Bullish Engulfing pattern, where a large bullish candle completely engulfs the previous bearish candle, signals that buyers have truly taken control. If this pattern forms shortly after the Inverted Hammer—and on high volume—it significantly strengthens the bullish outlook.
Even if a Bullish Engulfing appears a few candles later, it still acts as confirmation—especially if the price starts making higher highs. This sequence tells us that sellers are losing control, and buyers are gaining strength.
Example: Step-by-Step Inverted Hammer Analysis
Let’s analyze a real market scenario. Imagine you’re tracking a stock in a downtrend, and suddenly, this sequence of candles unfolds:
 Candle-1: The market is in a strong downtrend, but suddenly, an Inverted Hammer Candlestick with high volume appears. What does this mean?
- This is the first warning sign that buyers are stepping in. It doesn’t confirm a reversal yet, but it’s a warning that the selling pressure might be fading.
- Now, if you were watching this, what would you do? Would you still short aggressively, or would you start being cautious?
Candle-2 & 3: Another Inverted Hammer Candlestick forms, but this time with slightly average volume. What’s happening here?
- The downtrend is showing more weakness—sellers are still trying to push lower, but they’re losing control. If you’re looking for a long position, it’s time to be on high alert.
Candle-4: A weak bullish candle with an upper wick form. What does this mean?
- Buyers are still not strong enough. The trend reversal isn’t confirmed yet. Wait for further price action to unfold.
Candle-5: A full red bearish candle appears. Does this mean the downtrend will continue?
- Price action alone suggests that the downtrend may persist. But wait—what does volume tell us?
- The volume is very low, meaning there is weakness in the selling pressure. The warning sign for a bullish reversal continues.
Candle-6: A Bullish Engulfing candle appears with slightly increasing volume. What happens next?
- Boom! Buyers step in with force, confirming the reversal. The trend shifts, and a strong uptrend follows.
Now, imagine you saw this exact setup in real time—how would you trade it? Would you have the patience to wait for confirmation?
- If you were short, would you start reducing exposure?
- If you were looking for a long entry, would you wait for a confirmation?
This is how price action with volume confirms a story. Watch closely, wait for the right moment, and trade with confidence.
How to Trade the Inverted Hammer Candlestick Pattern?
So, how do you trade it? The answer lies in patience and observation.
- Observe, don’t react. An Inverted Hammer Candlestick is a warning, not an immediate buy signal. Just because you see one doesn’t mean you should jump into a long position right away.
- Wait for confirmation. Look for a Bullish Engulfing pattern, a Morning Star, or another sign of strength in the next few candles. If you see these signals, the probability of a reversal increases significantly.
- Watch volume closely. If the Inverted Hammer Candlestick forms on high volume, it carries far more weight. This suggests that institutional players might be stepping in to accumulate positions, preparing for a move higher.
- Consider additional confluence factors. Is there other technical analysis confirming the strength? Is the price approaching a major support level? The more confirmation you have, the stronger the trade setup.
The Power of Anticipation
When it comes to price action, one candle never tells the whole story. But when you combine the Inverted Hammer with volume analysis and confirmation signals, you gain a powerful edge—one that allows you to anticipate market strength before it fully unfolds.
So, the next time you spot an Inverted Hammer Candlestick at the bottom of a downtrend, don’t rush. Instead, take a step back, analyze the bigger picture, and let the market confirm your suspicions. If the signs align, you’ll be in a far better position to capitalize on the shift from bearish to bullish momentum.
Note: This article is part of Tradonomics’ Smart Money Secrets with Volume Price Analysis series. Explore it to unlock powerful trading insights and master Volume Price Action!