
What Are Candlestick Patterns?
Candlestick patterns are the footprints left behind, revealing the strengths, weaknesses, and possible next moves of these market warriors.

In our article, How to Read Price Action? The Story Candlesticks Tell, we explored how each candlestick holds valuable clues about market sentiment. But to truly analyze the chart with price action, we must dive deeper starting with “The Smallest Building Block of Technical Analysis: The Individual Candlestick”.

So, if you want to read a chart like a book, start with a single candlestick. This is why interpreting price action at the candlestick level is so crucial. Every candlestick tells a unique story—some whisper uncertainty, others scream reversal, while some confirm the strength of an ongoing trend.
Traders who master the art of reading these candles gain an edge, almost like deciphering a hidden language of the market. Each candle is a clue—put them together, and you unlock the bigger picture.
Why Are Candlestick Patterns important?
Candlestick patterns are the pulse of market sentiment. Regardless of the timeframe, each candle unveils critical information. But when combined with Volume Price Analysis (VPA), the real story emerges.
- Is the market showing strength or weakness?
- Are traders uncertain about the next move?
- Could smart money be influencing the price?
By analyzing these signals across multiple timeframes, traders can make more informed decisions and anticipate future price movements with greater accuracy.
But how do we truly decode this story?
Have you ever considered that every single candlestick or candlestick patterns on your chart represents a range in itself? This simple yet powerful observation can revolutionize the way you analyze charts and trade the markets. Once you fully grasp the significance of Candlestick Range Theory, you’ll uncover deeper insights into price action and refine your trading strategy like never before.
Let’s explore how.
What is Candlestick Range Theory?
Each candle on your chart isn’t just a random price movement—it’s a complete range of price action. It has a high, a low, an open, and a close. Instead of relying on arbitrary ranges that traders often define subjectively, we already have objective, clearly defined levels provided by each candle.
Every candle’s high and low naturally act as key support and resistance levels to watch.

But does that mean every single candle’s high and low should be treated as major levels? Not exactly. The real strength of these levels depends on the price action that follows, which is best analysed by zooming into lower timeframes.
Why Are Candlestick Ranges Superior to Typical Ranges?
Unlike conventional ranges where traders manually select a high and a low, candlestick ranges remove subjectivity. A candle’s high is its high, and its low is its low—there’s no debate. This makes candlestick range theory one of the most precise ways to analyze market structure.
Think of it this way: What you see as a lower-timeframe range is simply a higher-timeframe candle broken down into smaller parts. It follows all the same principles of range trading but with added clarity and precision. Instead of drawing zones manually, you can rely on the natural structure of candlesticks to make more effective trading decisions.
Are you struggling with multiple time frame analysis?
Your Lower-Timeframe Range is Just a Higher-Timeframe Candle. This concept is a game-changer, especially if you find multi-timeframe analysis confusing. Ever wondered why price behaves a certain way on a smaller timeframe? Zoom out, and the answer will often be right in front of you.
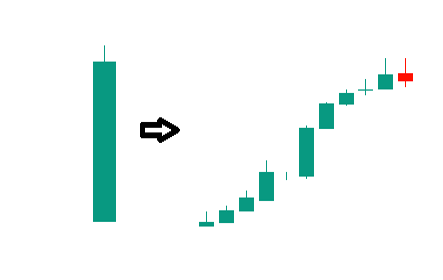
For example, if you’re analyzing a Daily Candlestick as below, remember that it encapsulates all the lower timeframe candles within that day.

Day Candle
Here’s how:

Day Candle at Lower Time Frame (15-MTF) Chart
- Open Price: The first price of the day, which is the open price of the first 15-minute candle.
- Close Price: The last price of the day, which is the close price of the last 15-minute candle.
- High Price: The highest point reached by any 15-minute candle within that day.
- Low Price: The lowest point reached by any 15-minute candle within that day.
If you’re ever unsure about how a higher timeframe candle formed, just switch to a lower timeframe and analyze the price movement within that period—it will make everything clearer.
Personally, I start my daily pre-market analysis by looking at the daily chart. It sets the foundation for the trading day and helps me pinpoint key price levels that are likely to influence market behavior.
Now, the big question is: How do you analyze price action through High Time Frame Candlestick Patterns?
Hold on! We’re about to break down each type of candlestick in the next section. Stay tuned!
But first, let’s summarize the key takeaway:
Every candlestick is a range. Every range is a story. The better you understand these stories, the better your trading decisions will become.
How do you analyze price action through Candlestick Patterns?
Candlestick patterns are a cornerstone of technical analysis. Each candlestick on a chart represents price action within a specific time frame (e.g., one day, one hour). Candlestick patterns help traders understand market sentiment and make predictions about future price movements. They can be broadly categorized into three types based on market sentiment:
- Bullish candles
- Bearish candles and
- Indecisive candles
Now, we will explore how to read price action through Candlestick Range Theory (CRT) by analyzing these three main categories of candles in a broader market context.
Bullish Candle
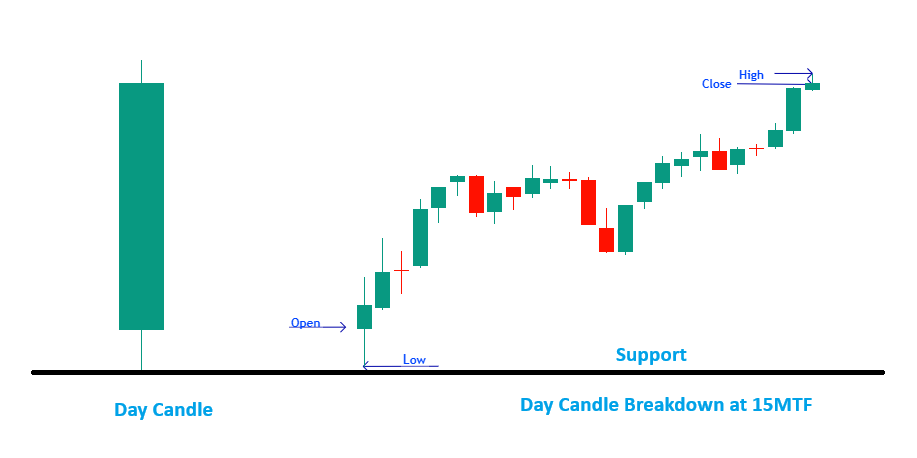
A bullish candle indicates that buyers were dominant during the period, pushing prices higher from the opening to the closing price. If the candle lacks an upper wick, it implies that the closing price is the highest of the session, signaling strong buying sentiment.
- Significance of the Low: The lowest point of a bullish candle represents where buyers gained control, making it a critical level of interest. A strong bullish candle with high volume suggests institutional accumulation, confirming buyer interest.
- Psychological Significance: Traders often view the low of a strong bullish candle as a key psychological level, as many traders may have entered long positions around this price and will likely defend it or make new positions who missed initially, if the price revisits this level.
- Higher Timeframe Impact: If the bullish candle appears on a higher timeframe, its significance increases. The low of the bullish candle marks an area where buying pressure was strong enough to reverse the price direction. If the price returns to this level, buyers may step in again, establishing strong support.
- Trading Perspective: The low of a bullish candle can act as a key support level, indicating where buyers took control. Monitoring this level can help traders identify potential long entry points and gauge the strength of the upward momentum.
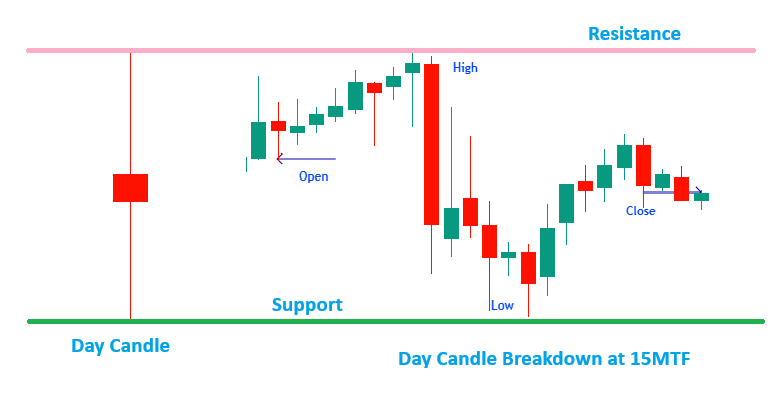
Bearish Candle

A bearish candle signifies that sellers were dominant, pushing prices lower from the open to the close. If the candle lacks a lower wick, it implies that the closing price is the lowest of the session, reinforcing strong selling pressure.
- Significance of the High: The highest point of a bearish candle represents where sellers took control, making it a crucial level of interest. A strong bullish candle with high volume suggests institutional accumulation, confirming buyer interest.
- Psychological Significance: Traders often see the high of a strong bearish candle as a key psychological level. Many traders may have entered short positions around this price and will likely defend it if the price revisits this level.
- Higher Timeframe Impact: If the bearish candle appears on a higher timeframe, its significance increases. The high of the bearish candle marks a level where selling pressure was strong enough to reverse the price direction. If the price returns to this level, sellers may step in again, providing strong resistance.
- Trading Perspective: The high of a bearish candle can act as a significant resistance level, indicating where sellers dominated. Monitoring this level can help traders identify potential short entry points and assess the strength of the downward momentum.
Doji Candle
A Doji candle reflects indecision in the market, where buying and selling pressures are balanced, resulting in an open and close that are nearly identical. The absence of a significant body suggests neither side gained clear control, indicating neutrality.
- Significance of the High and Low: The Doji’s extremes mark critical price levels, acting as potential support and resistance zones. Many traders react to these levels when revisited. A Doji with high volume suggests a strong battle between buyers and sellers.
- Psychological Significance: Traders often consider the high and low of a Doji candle as key psychological levels. Many traders may have entered positions around these levels and are likely to react if the price revisits them.
- Higher Timeframe Impact: A Doji candle on a higher timeframe signifies market equilibrium and often precedes significant breakouts. The high and low mark areas where buying and selling pressure were balanced. If the price returns to these levels, traders may again show strong reactions, potentially creating support at the low and resistance at the high.
- Trading Perspective: The range between the high and low of a Doji candle can act as an important support and resistance zone. Monitoring these levels can help traders identify potential long and short entry points and evaluate the market’s indecision.
Conclusion
Here’s how you can use higher timeframe candles highs and lows to make better trading decisions:
- Bullish Candle – Low as Support
When buyers take control, the low of a bullish candle becomes a critical support zone. If the price dips back to this level, watch for buyers stepping in again—this could be your next long opportunity! - Bearish Candle – High as Resistance
Sellers dominated? The high of a bearish candle often acts as a strong resistance. If the price climbs back up to this level, expect sellers to defend it—it could be the perfect spot for a short trade. - Doji Candle – High & Low as Decision Zones
A Doji signals indecision, meaning both the high and low are key battle zones. A breakout beyond either side could reveal the market’s next big move—stay sharp and be ready!
So, next time you look at a chart, don’t just see candles—see the stories they tell and the ranges they form. Once you do, your trading will never be the same.
In the next section, we will break down individual candlestick formations like the Hammer, Inverted Hammer, Shooting Star, and Hanging Man. Stay tuned!
Note: This article is part of Tradonomics’ Smart Money Secrets with Volume Price Analysis series. Explore it to unlock powerful trading insights and master Volume Price Action!