
The shooting star candlestick pattern is one of the most powerful and widely recognized candlestick patterns in trading. It serves as a crucial signal in price action analysis, often indicating either temporary resistance or the potential for a longer-term trend reversal.
No matter the market or timeframe, spotting a shooting star candle can provide valuable insights into market sentiment and trader psychology. But how do we identify a true shooting star candle, and more importantly, how do we trade it profitably? Let’s break it down!
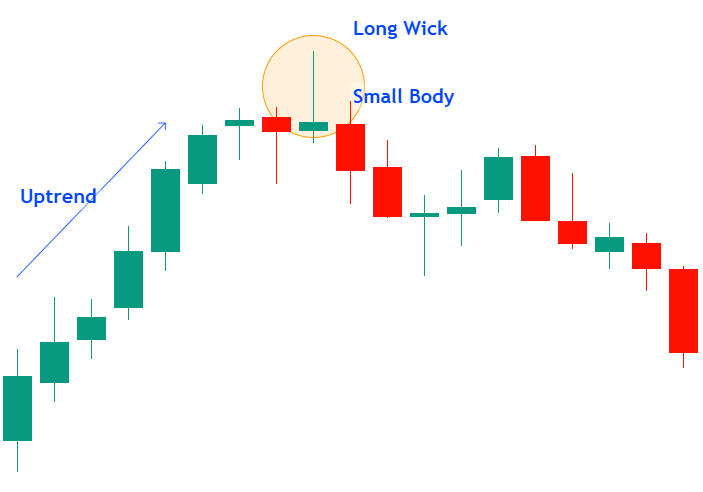
Five-Point Checklist to Identify the Shooting Star Candlestick Pattern
What does a shooting star candlestick look like? Here’s a simple five-point checklist to identify one:
- The prevailing trend must be an uptrend.
- The candle has a small real body near the bottom of the range.
- The wick at the top must be significantly longer than the body (usually in a 2:1 ratio).
- At the bottom, it should have little to no lower wick.
- The color of the body doesn’t matter, but a red candle strengthens the signal.
Seems easy enough, right? But why does this pattern form in the first place? That’s where price action comes into play.
What Does a Shooting Star Candlestick Indicate in the Stock Market?
Price Action: A Sign of Weakness
Each candlestick on a chart represents price action over a specific time period, with every candle forming its own price range. A higher timeframe candle is essentially a combination of multiple lower timeframe candles, aggregating their price movements.
To truly understand the structure and significance of a higher timeframe candle, switch to a lower timeframe chart and examine the individual candles within the same period. This approach helps eliminate doubts and provides deeper clarity on market behaviour.
Now, if we break a shooting star candle down into two lower timeframe candles, what would it look like?
Let’s analyze:
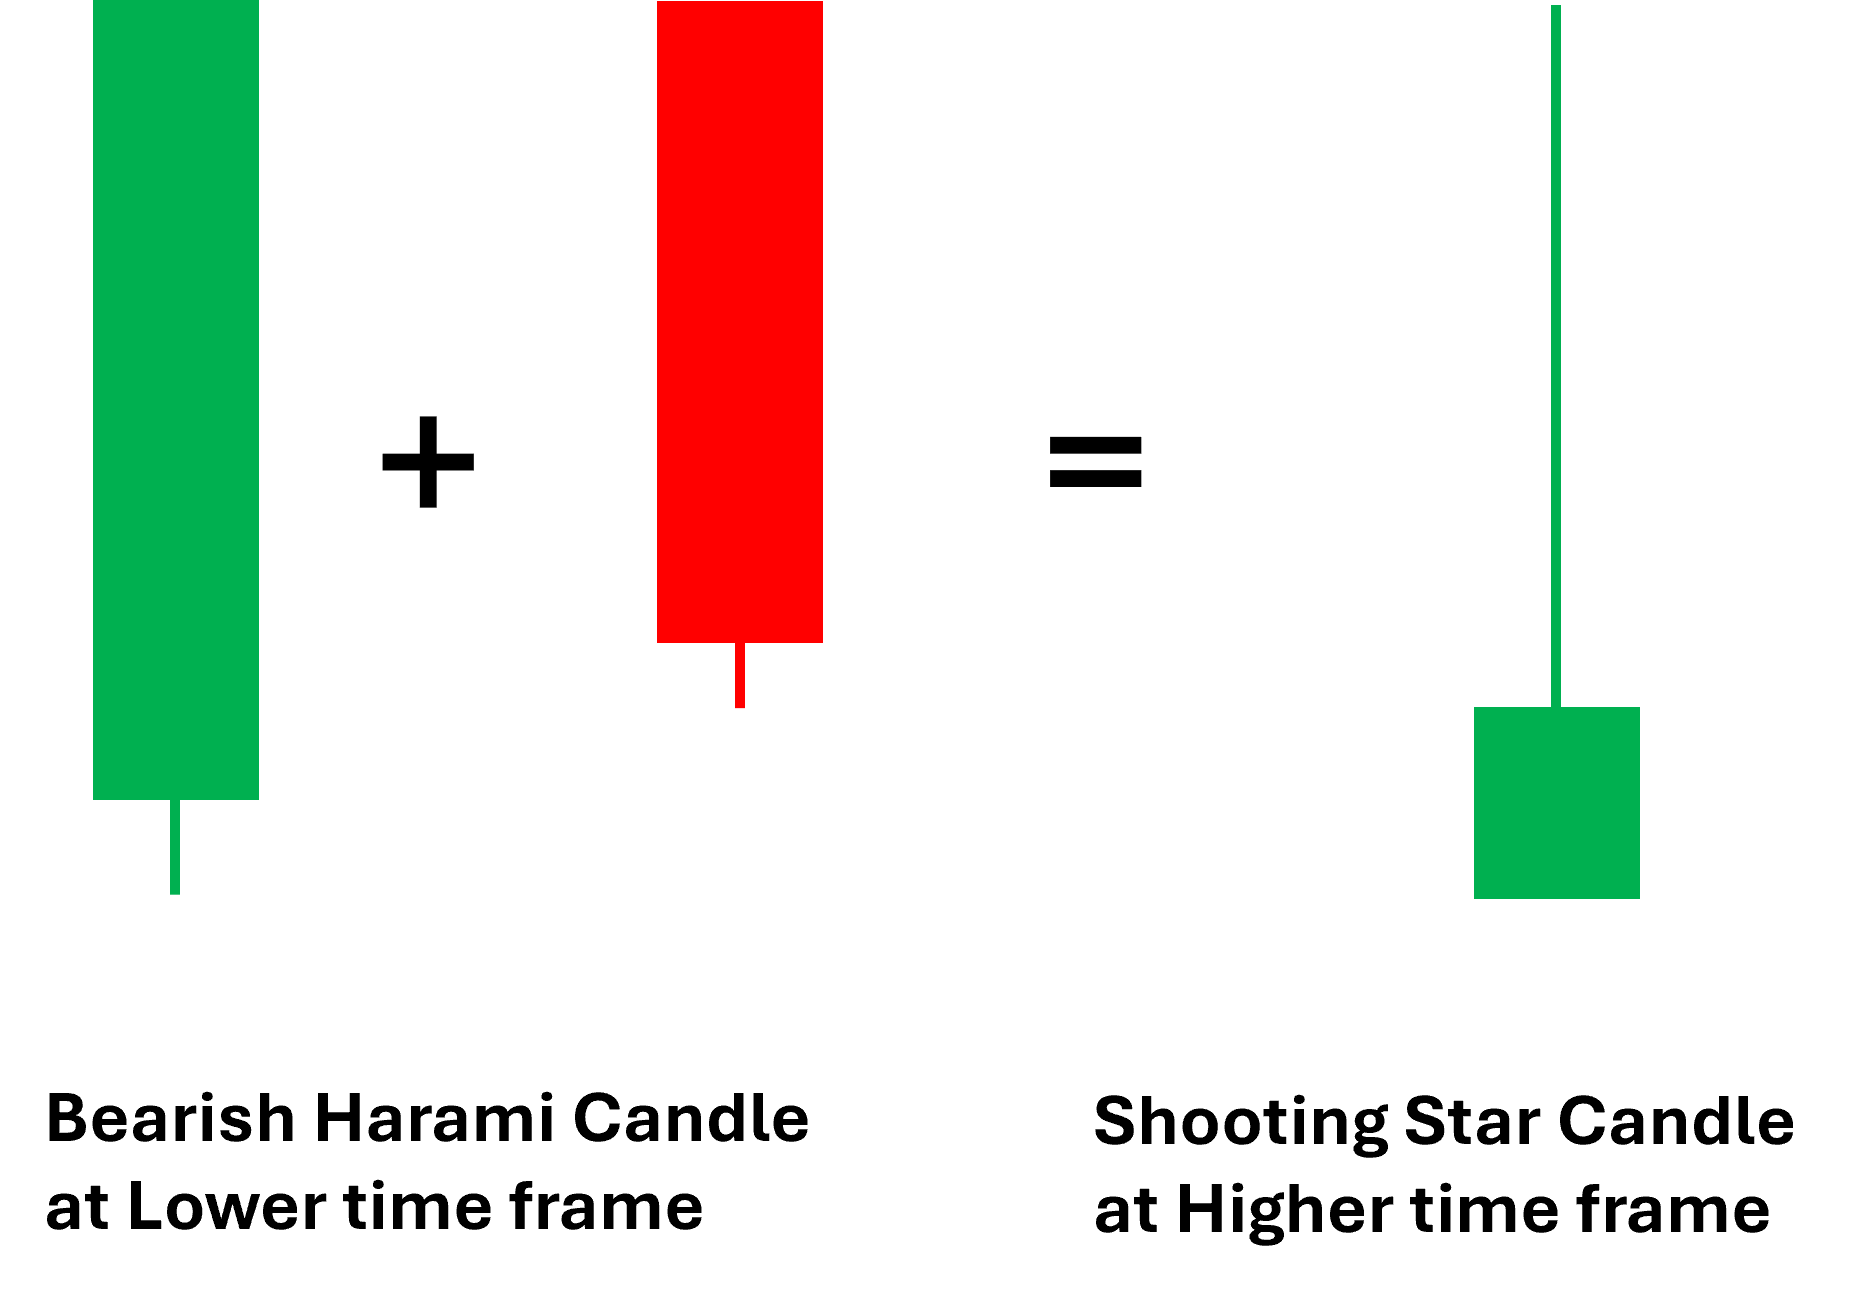
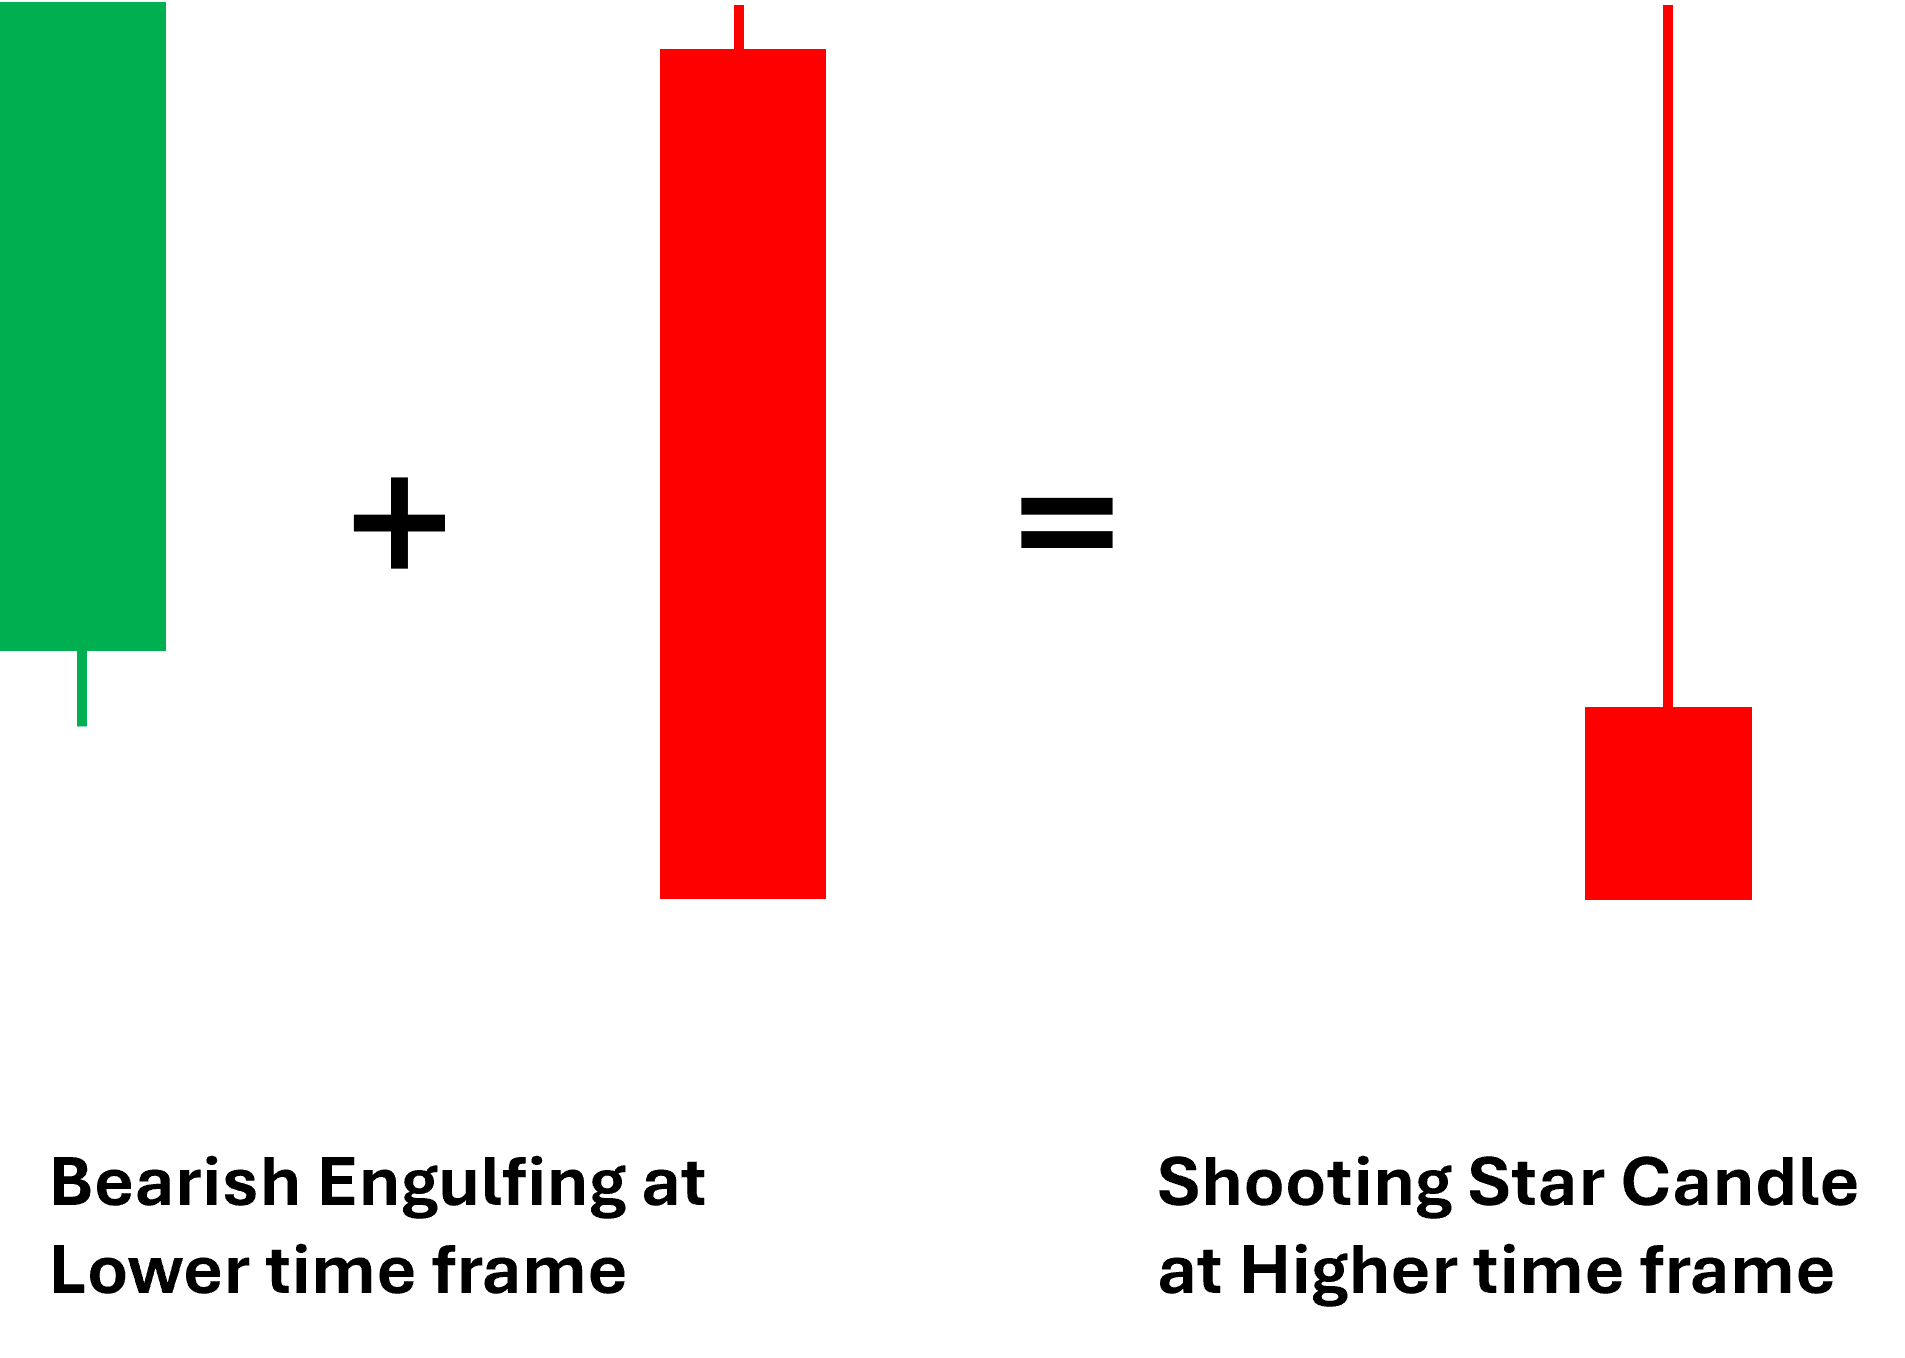
A Shooting Star candle forms when the price initially rises within a session but then reverses, rallying to close near or below its opening price. This tells us that buying pressure was strong at first, but sellers eventually stepped in with enough force to push the price back down.
So, what do we get? A small real body near the bottom with a long upper wick—shaped like a shooting star, quite literally “testing out a top.” But does that mean we should instantly enter a trade? Not so fast!
The Psychology Behind the Shooting Star Candle
To truly understand the shooting star, we need to think like the big players—the institutional traders, market makers, and professionals who move the market.
When the market is in an uptrend, these insiders need to exit their long positions before they can push prices lower. The shooting star often signals that they are stepping in to sell, but this doesn’t mean an immediate reversal. Instead, price may drop briefly before attempting to push higher again. That’s why understanding volume is key.
Shooting Star Candles and Volume Analysis
How to Interpret Volume in Shooting Star Patterns
When analyzing charts, you may notice multiple shooting star candlestick patterns appearing. But the key question is: how do you identify a high-probability reversal shooting star candlestick pattern? The answer lies in volume and market context.
A shooting star candle alone does not guarantee a market reversal. Instead, the volume behind the candle plays a crucial role in confirming its significance.
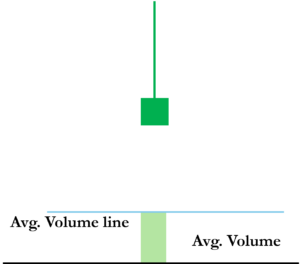
- Low Volume: A shooting star with low volume suggests weak selling interest. It may trigger a temporary pullback but lacks the strength for a major reversal.
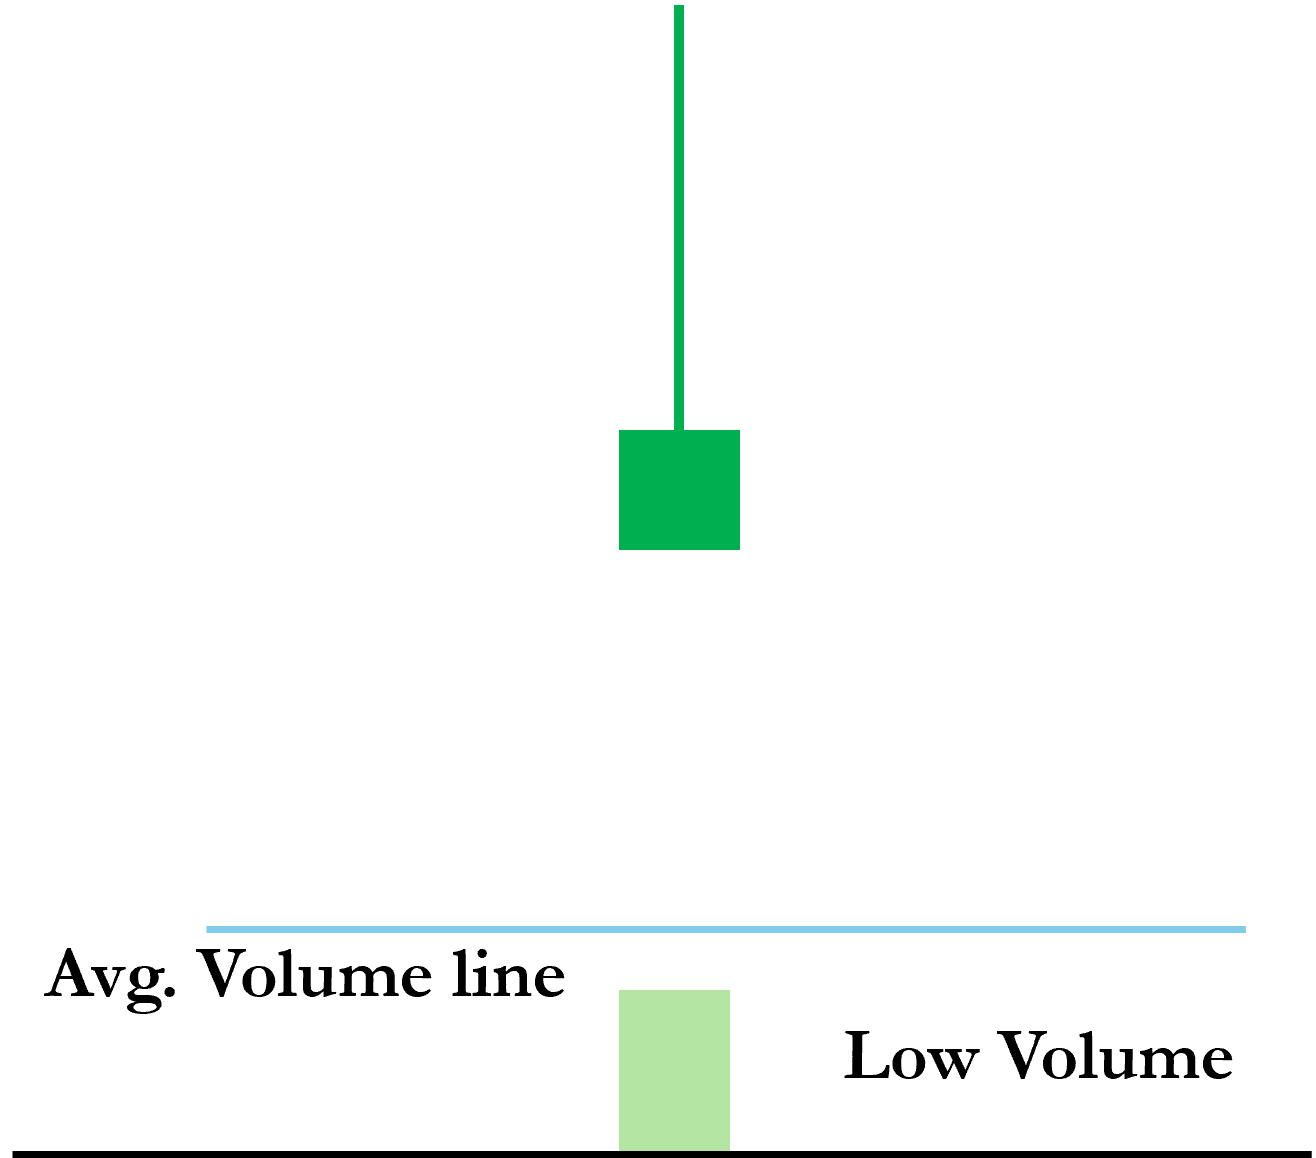
- Average Volume: This is a stronger signal of potential reversal and can present an opportunity for short-term trades.
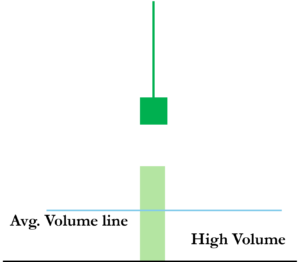
- High or Ultra-High Volume: This signals significant insider selling. It often marks the beginning of distribution, where professionals are offloading large positions before a bearish move.
Context Matters: Price Action & Support/Resistance
The interpretation of a shooting star candle depends heavily on where it appears in the broader trend:
- If a shooting star emerges after a prolonged uptrend, it signals potential weakness, but not necessarily an immediate reversal.
- If it forms near a historically significant resistance level, its bearish implication is stronger.
- If it appears shortly after an accumulation phase, it is less likely to trigger a major downturn immediately.
Waiting for confirmation from subsequent candles is crucial. A second shooting star with higher volume, or narrow range candles with above-average volume, strengthens the bearish signal.
Shooting Star candlestick pattern in technical analysis
How to Spot a High-Probability Reversal
When analyzing price charts, it’s common to see multiple shooting star candlestick patterns appear. But the real challenge lies in identifying which ones signal a true market reversal and which are merely pauses in an ongoing trend.
So, how do you distinguish a high-probability shooting star reversal? The answer lies in two critical factors: volume and market context.
Whenever a shooting star forms, ask yourself:
- Is this candle just a brief hesitation in the trend, or does it mark the beginning of a reversal?
- What does the volume reveal about insider activity—are they offloading positions or just watching the market?
- How does this shooting star interact with other price action signals?
- Where is it forming within the broader market structure, particularly on higher time frames?
A shooting star with ultra-high volume, especially when formed at a higher time frame resistance, often indicates that insiders are unloading their long positions and initiating shorts, preparing for a downtrend. These signals frequently appear during distribution phases or just before a breakdown, as smart money tests whether buying pressure still exists before committing to a full reversal.
Recognizing the shooting star in the right context can provide a significant trading edge. It’s not just about spotting the pattern—it’s about understanding the story the market is telling.
Still with me? Awesome! Now, let’s discuss how to actually trade the shooting star candlestick pattern.
How to Trade the Shooting Star Candlestick Pattern?
Entry and Stop-Loss Strategy
Entry Confirmation:
- Wait for the next candle after the shooting star to close below its low. This confirms bearish momentum.
- Enter a short position once price breaks the low of the shooting star candle.
- For aggressive traders, entry can be taken at the close of the shooting star candle if it closes near its low.
Stop-Loss Placement:
- Set the stop-loss just above the high of the shooting star candle.
- If the wick is too long, a tighter stop can be placed at the midpoint of the shooting star if a resistance level confirms the entry.
Take-profit target: Aim for the next support level or a 1:2 risk-to-reward ratio.
Trading Strategies for the Shooting Star Candlestick
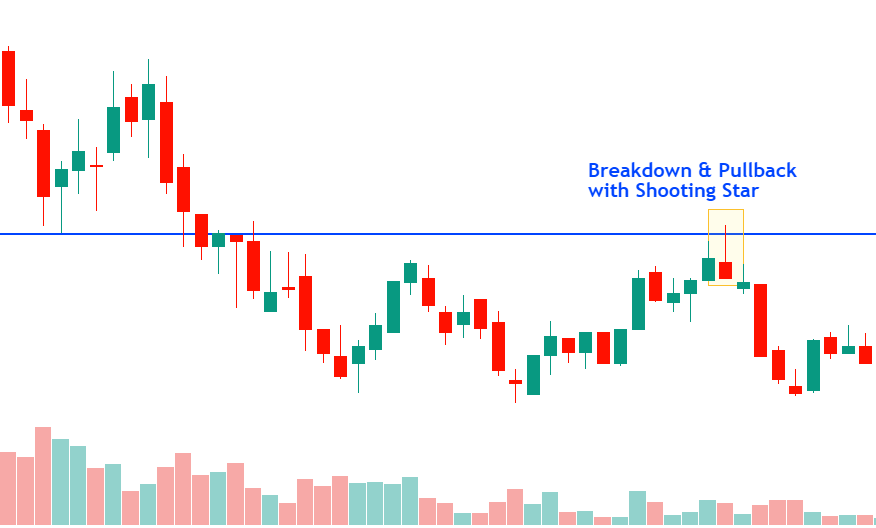
Strategy 1: Pullback after Breakout
As a bearish reversal pattern, the Shooting Star Candle is a great pattern to watch for when the price is on a downtrend. Just wait for a pullback to start and then spot when the Shooting Star Candle appears.
This often signals the end of the pullback and the start of the next downward move.
- Identify a breakdown of support.
- Wait for a pullback to resistance and a shooting star to form.
- Enter a short trade when the price breaks the low of the shooting star.
- Stop-loss: Above the high of the shooting star.
- Target: Next support level or a 2x risk-reward ratio.
Here’s an example:
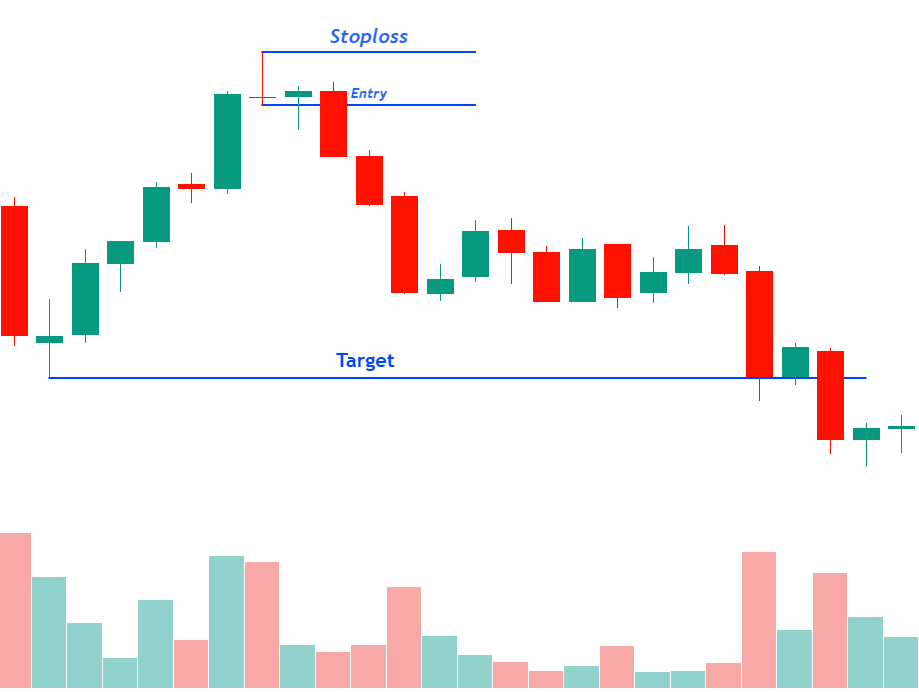
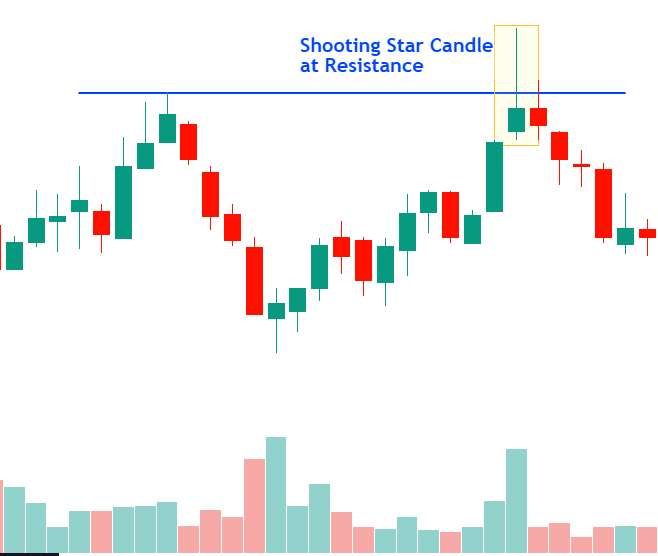
Strategy 2: Trading The Shooting Star with Resistance Levels
Support and resistance levels are great places to find price reversals. Since we are looking for moves to the downside, we want to trade the Shooting Star Candle using resistance levels.
How does it work:
- Draw resistance levels on your charts.
- Wait for the price to rise and hit the resistance level.
- Check if a shooting star appears at that level.
- Enter short when price breaks the low of the shooting star.
- Stop-loss: Above the high of the shooting star.
- Target: Next support level or a 2x risk-reward ratio.
Here’s an example:
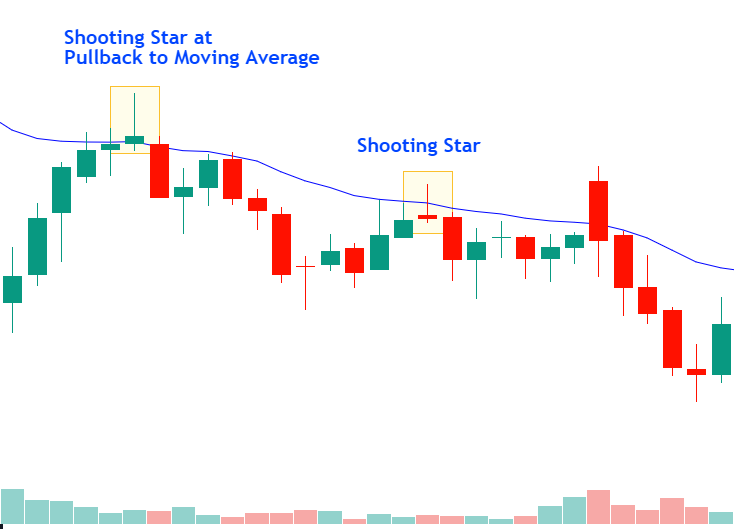
Strategy 3: Trading The Shooting Star with Moving Averages
Moving averages are great trading indicators to trade trends. The idea here is to trade pullbacks to the moving average when the price is on a downtrend.
How does it work:
- Find a downtrend with price below a moving average.
- Wait for a pullback in price to the moving average.
- Check if a shooting star appears at the moving average.
- Enter short when price breaks the low of the shooting star.
- Stop-loss: Above the high of the shooting star.
- Target: Another leg to the downside.
Here’s an example:
Strategy 4: Trading The Shooting Star with Pivot Points
Pivot Points are automatic support and resistance levels calculated using previous day High, Low, Open & Close. If you are day trading, the Daily Pivot Points are the most popular and also used by smart money.
Here’s how to trade the shooting star candlestick pattern with Pivot Points:
- Activate the Pivot Points indicator on your charts.
- Look for shooting star formations at pivot resistance levels.
- Enter short when price breaks the low of the shooting star.
- Stop-loss: Above the high of the shooting star.
- Target: Next support pivot level.
The Shooting Star Candle’s Role in Trend Trading
One of the hardest skills in trading is staying in a trend and not exiting too early. The shooting star candle, combined with Volume Price Analysis (VPA), can help traders hold their positions with confidence.
For instance, suppose you are long in an uptrend, and a shooting star candle appears. Should you close your position? If the shooting star volume is low, the answer is likely no—there isn’t enough selling pressure to reverse the trend. But if it’s followed by a widespread candle with high volume & closes below shooting star candle low, this confirms continued weakness, and you can close your long position in your short trade.
On the other hand, if a shooting star appears with ultra-high volume, this is a warning sign that big money is stepping in. It may be time to start taking profits on your long position and preparing for a potential short trade when a breakdown occurs.
The shooting star, combined with Volume Price Analysis (VPA), helps traders identify trend exhaustion and potential reversal points.
- Weak Volume: Trend continuation is likely.
- High Volume: Signals distribution and potential reversal.
Shooting Stars in the Bigger Picture
The shooting star candle is a valuable warning signal, but it should never be interpreted in isolation. Instead, combining it with:
- Volume analysis
- Support and resistance levels
- Broader market context
enables traders to make well-informed decisions.
While it is tempting to assume that a single shooting star marks the top of a trend, true mastery of VPA requires patience, context, and confirmation from volume and price action. Understanding these nuances helps traders anticipate market reversals with greater accuracy and confidence.
By mastering the shooting star candlestick pattern and Volume Price Analysis, traders can:
- Enter trades with confidence
- Stay in winning positions longer
- Avoid premature exits
Now that you understand the shooting star candlestick pattern inside out, are you ready to use it in your trading?
Note: This article is part of Tradonomics’ Smart Money Secrets with Volume Price Analysis series. Explore it to unlock powerful trading insights and master Volume Price Action!