
Before we dive deep into Volume Price Analysis (VPA), let’s start with some guiding principles. These aren’t strict rules but rather key insights that will help you understand and apply VPA more effectively.
So, let me ask you—have you ever looked at a price chart and felt lost, unsure of what the volume bars really mean? Don’t worry, you’re not alone. One of the biggest mistakes traders make is analyzing volume in isolation. That brings us to our first principle.
Principle No. 1: Volume is Relative
Volume is never absolute; it’s always relative to something else. You can’t just look at today’s volume and say, “Wow, this is high!” unless you compare it to past trading activity.
Analogy: The Law of Relative Motion and Volume Analysis
Let me explain it this way—have you ever been on a moving train and noticed how the trees outside seem to fly past you, while the person sitting next to you appears completely still? That’s because motion is relative to your perspective.
Volume works the same way. A sudden spike in volume might seem important, but unless you compare it to previous volume levels and price action, you won’t know whether it’s truly significant. Just like movement is only meaningful when compared to another object, volume is only meaningful when compared to past trading behavior.
Understanding Relativity in Volume Analysis
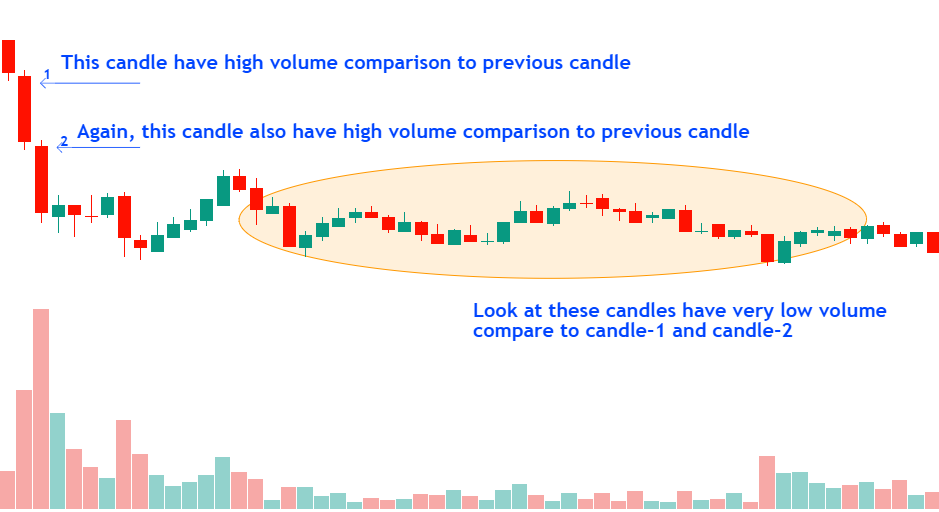
Think about it: if a stock trades 500,000 shares in a day, is that high volume or low volume? Well, it depends! For some stocks, that’s a huge amount. For others, it’s barely anything.
The same goes for a volume spike—if today’s volume is much higher than the 50-day average, it’s worth paying attention to. But if it’s just slightly above normal, it may not be as significant.
Volume in Different Market Conditions
Let’s break it down further. Volume must always be analyzed in context:
- Relative to Previous Sessions:
- If today’s volume is higher than yesterdays and the price is rising, it shows strong buying pressure.
- If volume is dropping while the price rises, momentum might be weakening, hinting at a reversal.
- Relative to Key Market Events:
- During earnings releases or big economic events, volume spikes can signal major sentiment shifts.
- If volume stays low during such events, it means traders aren’t reacting strongly—probably a sign of market hesitation.
- Relative to Different Timeframes:
- A volume spike on a 5-minute chart may look dramatic, but when you zoom out to the daily chart, it might not even register as significant.
- The bigger the timeframe, the more reliable the volume confirmation.
Let’s understand this with the example:
Using Moving Averages to Establish Relative Volume
Now, how do you make sure you’re comparing volume correctly? Simple use moving averages.
- 50-period moving average of volume: Helps filter out noise and spot meaningful spikes.
- Volume Weighted Average Price (VWAP): Tells you if big institutional traders are getting involved.
Bottom line: never analyze volume in isolation. A high or low volume day is only meaningful when viewed in relation to previous trading activity. Keep this in mind, and you’ll avoid false signals while making smarter trading decisions.
That leads us to our next principle.
Principle No. 2: Technical Analysis Complements VPA
Let’s be real—VPA alone won’t give you the full picture. To truly understand market movements, you need to combine it with other technical analysis tools.
One of the most powerful tools? Support and resistance levels.
Think about it—markets don’t just move randomly. They pause, consolidate, and gather strength at key levels before making their next move. Sometimes, these levels act as reversal points, while other times, they serve as steppingstones for a trend continuation.
But how do you confirm whether a breakout or reversal is real? With volume.
Why Volume Matters in Breakouts
- A breakout from a consolidation zone with strong volume is highly reliable.
- A breakout on low volume? Be cautious—it could be a fake move.
The same logic applies to trends and price patterns. Recognizing patterns—whether they’re continuation or reversal formations—helps you anticipate price movements. But to confirm their validity, volume is your best friend.
I’ll dive deeper into technical analysis in my Technical Analysis Articles, but for now, just remember: VPA + Technical Analysis = A Complete Trading Strategy.
Principle No. 3: Validation or Divergence
At its core, VPA comes down to two simple questions:
- Does volume confirm the price move?
- Or is there an anomaly between volume and price?
When price action is backed by volume, it’s a sign of strength—meaning the trend is likely to continue. But when price and volume contradict each other, beware—it might indicate a reversal or a fake-out.
Let’s Look an Example below:
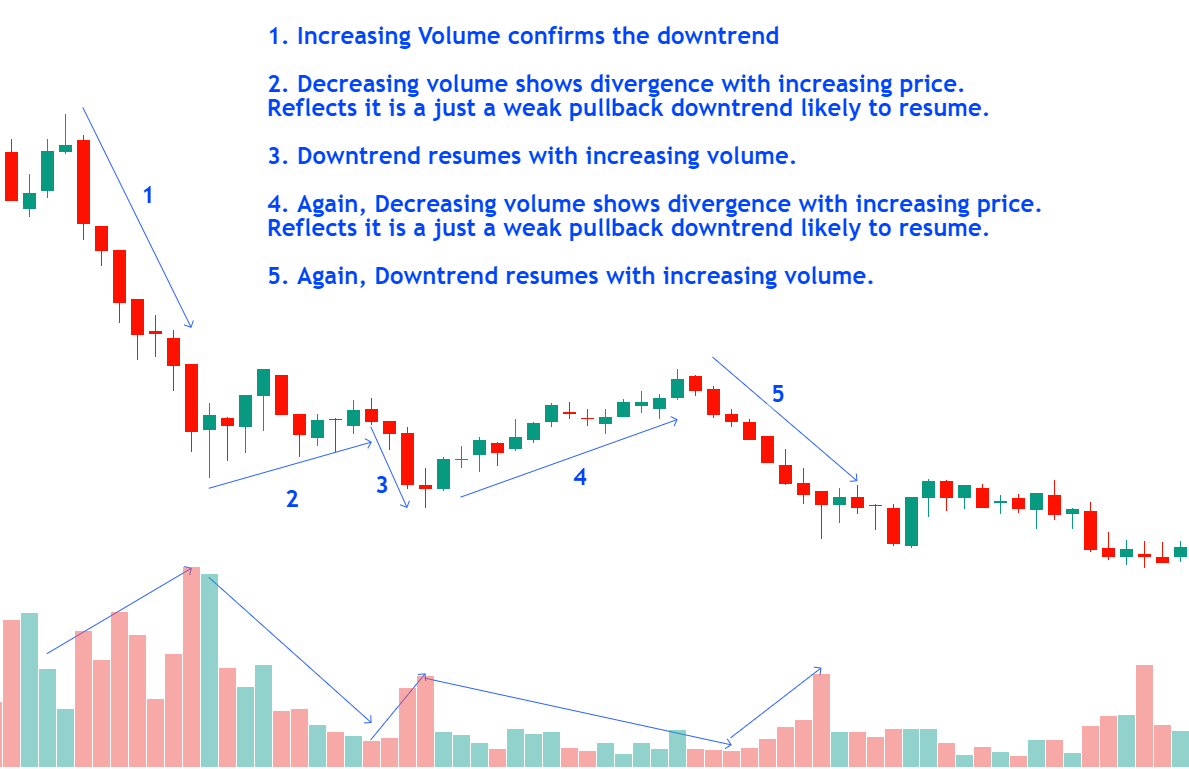
Volume Validation: Price swing 1, 3 & 5
Price is falling downward on high volume—this confirms the move, signaling genuine selling interest and likely continuation.
Volume Divergence: Price swing 2 & 4
Now, the price is rising, but volume is low. That’s a red flag. It suggests a lack of conviction and weak pullback, meaning the move may not sustain and could reverse soon.
Understanding these two scenarios—validation or divergence—is the foundation of VPA. Once you master this, the market starts making a lot more sense.
Final Thoughts
If there’s one thing, I want you to take away from this, it’s this: volume alone doesn’t tell the full story. It must always be analyzed in relation to past volume, price action, and market context.
By keeping these three principles in mind:
- Volume is always relative—never absolute.
- Technical analysis complements VPA—they go hand in hand.
- Look for validation or divergence—volume should confirm price moves, or it signals something is off.
Follow these principles, and you’ll start seeing the market in a whole new way. So, are you ready to dive deeper into Volume Price Analysis? Let’s go!
In the next two article, we will discuss Validation or Divergence on a single candlestick in detail—stay tuned!
Note: This article is part of Tradonomics’ Smart Money Secrets with Volume Price Analysis series. Explore it to unlock powerful trading insights and master Volume Price Action!