
In the previous article, we discussed the basics of Trading Volume Analysis: what trading volume is, how to analyze it, and how it reveals the footprints of Smart Money in the markets. In continuation with that, this article will dive deeper into Price Volume Analysis, a powerful method to understand how price moves are driven by the tug-of-war between supply and demand, with institutional players often steering trends behind the scenes.
Building on the foundations of Price Volume Analysis, it is time to dive deeper into how volume shapes market behavior and why is market moving. While price shows the effect of market moves, volume reveals the intent behind them and the real story of who is buying, who is selling, and when sentiment is about to shift.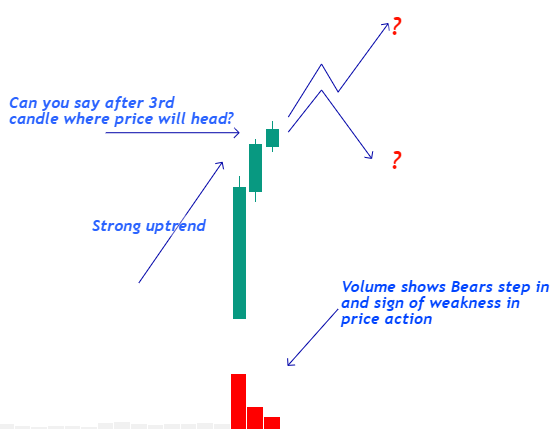
As one trading pioneer said, “The market is made up of human beings and their hopes, fears, and greed. Volume is the testimony of their actions.”
Another famous trader said, “Climaxes are your best friends. They tell you where professionals changed sides.” These timeless insights highlight why volume is not just an optional tool. It is an essential lens through which to understand price behavior.
Before we proceed with Price Volume Analysis, let’s begin with five guiding principles of Price Volume Analysis. These are not rigid rules, but key insights that will help you interpret volume more effectively and apply VPA in real trading.
Principle No. 1: Volume is Relative
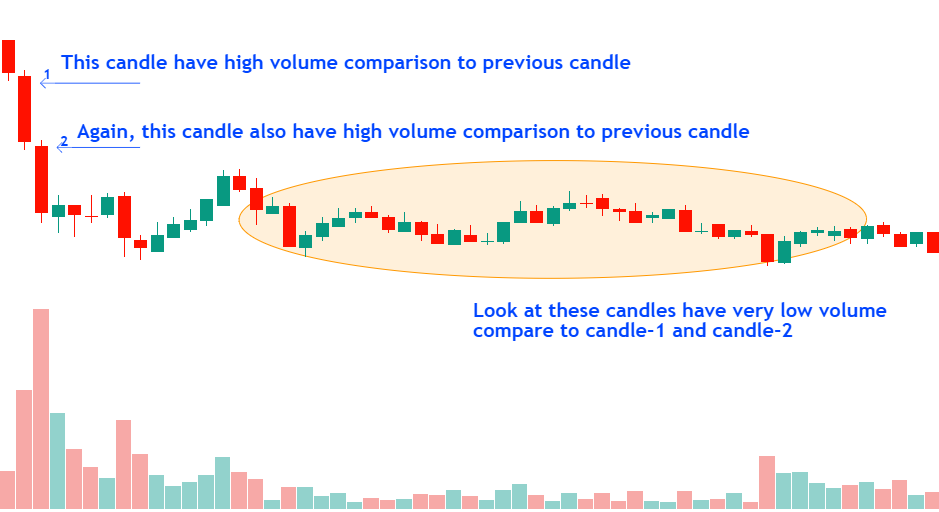
Volume is never absolute; it is always relative to something else. You can not just look at today trading volume and say, Wow, this is high! unless you compare it to past trading activity.
Analogy: The Law of Relative Motion and Volume Analysis
Let me explain it this way, have you ever been on a moving train and noticed how the trees outside seem to fly past you, while the person sitting next to you appears completely still? That is because motion is relative to your perspective.
Volume works the same way. A sudden spike in volume might seem important, but unless you compare it to previous volume levels and price action, you won’t know whether it is truly significant. Just like movement is only meaningful when compared to another object, volume is only meaningful when compared to past trading behavior.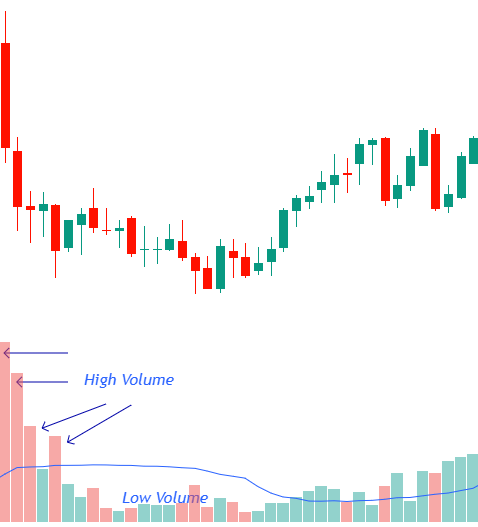
Understanding Relativity in Volume Analysis
Think about it: if a stock trades 500,000 shares in a day, is that high volume or low volume? Well, it depends! For some stocks, that’s a huge amount. For others, it is barely anything.
The same goes for a volume spike: if today volume is much higher than the 50-day average, it is worth paying attention to. But if it is just slightly above normal, it may not be as significant.
Volume in Different Market Conditions
Let’s break it down further. Volume must always be analyzed in context:
- Relative to Previous Sessions:
- If today’s volume is higher than yesterdays and the price is rising, it shows strong buying pressure.
- If volume is dropping while the price rises, momentum might be weakening, hinting at a reversal.
- Relative to Key Market Events:
- During earnings releases or big economic events, volume spikes can signal major sentiment shifts.
- If volume stays low during such events, it means traders aren’t reacting strongly—probably a sign of market hesitation.
- Relative to Different Timeframes:
- A volume spike on a 5-minute chart may look dramatic, but when you zoom out to the daily chart, it might not even register as significant.
- The bigger the timeframe, the more reliable the volume confirmation.
Let’s understand this with the example:
Using Moving Averages to Establish Relative Volume
Now, how do you make sure you are comparing volume correctly? Simple use moving averages.
- 50-period moving average of volume: Helps filter out noise and spot meaningful spikes.
- Volume Weighted Average Price (VWAP): Tells you if smart money are getting involved.
Bottom line: never analyze volume in isolation. A high or low volume day is only meaningful when viewed in relation to previous trading activity. Keep this in mind, and you’ll avoid false signals while making smarter trading decisions.
That leads us to our next principle.
Principle No. 2: Volume Precedes Price
One of the most important principles in trading is that volume often leads price. According to Wyckoff Law, volume reveals the “Effort” behind a move, often before the “Result” appears on the chart.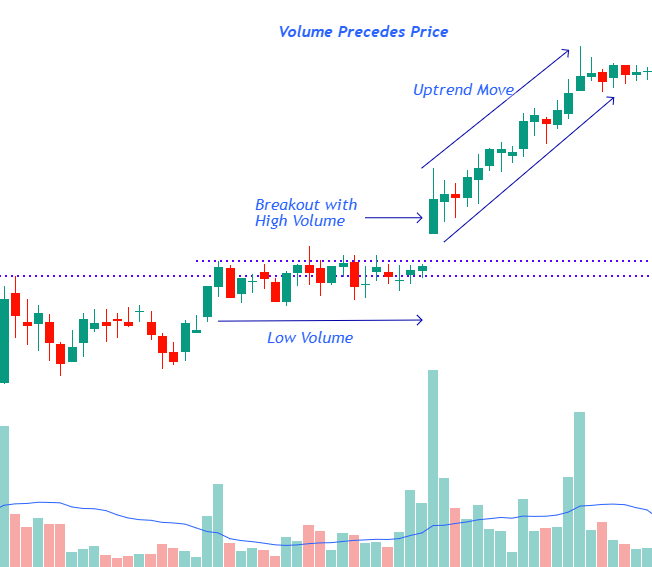
Smart money rarely waits for headlines or retail confirmation. Instead, professionals quietly engage in Accumulation during low-volume phases and then drive Distribution when conditions are right.
- Before a breakout, you will often see volume expanding subtly during consolidation. This is a tell-tale sign that stronger hands are positioning before the crowd notices.
- In downtrends, sudden spikes in volume at the bottom often mark the start of a reversal and demand quietly returning before price actually turns.
Example: Imagine a stock trading sideways between ₹980 and ₹1,000 for months. Price is not moving much, but volume starts creeping up daily. A few days later, the price explodes above ₹1,000 with a surge in participation. Those who tracked volume saw the buildup coming, long before the breakout price confirmed it.
Watching volume changes during quiet periods. Price may be flat, but volume whispers the next big move.
Principle No. 3: Technical Analysis Complements Price Volume Analysis
Price Volume Analysis alone will not give you the full picture. To truly understand market movements, you need to combine it with other technical analysis tools.
One of the most powerful tools?
Support and Resistance levels.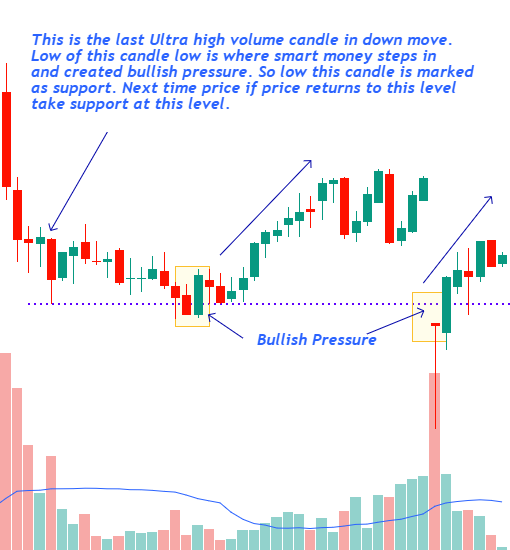
Think about it. Markets do not just move randomly. They pause, consolidate, and gather strength at key levels before making their next move. Sometimes, these levels act as reversal points, while other times, they serve as steppingstones for a trend continuation.
But how do you confirm whether a breakout or reversal is real?
With volume.
Why Volume Matters in Breakouts
- A breakout from a consolidation zone with strong volume is highly reliable.
- A breakout on low volume? Be cautious, it could be a fake move.
The same logic applies to trends and price patterns. Recognizing patterns whether they are continuation or reversal formations helps you anticipate price movements. But to confirm their validity, volume is your best friend.
I will discuss Technical Analysis in my Technical Analysis Article Series, but for now, just remember: VPA + Technical Analysis = A Complete Trading Strategy.
Principle No. 4: Volume Either Validates or Invalidates the Price
Price Volume Analysis comes down to two simple questions:
- Does volume confirm the price move?
- Or is there divergence between volume and price?
When price action is backed by volume, it is a sign of strength, meaning the trend is likely to continue. But when price and volume contradict each other, beware it might indicate a reversal or a fake-out.
Let’s Look an Example below:
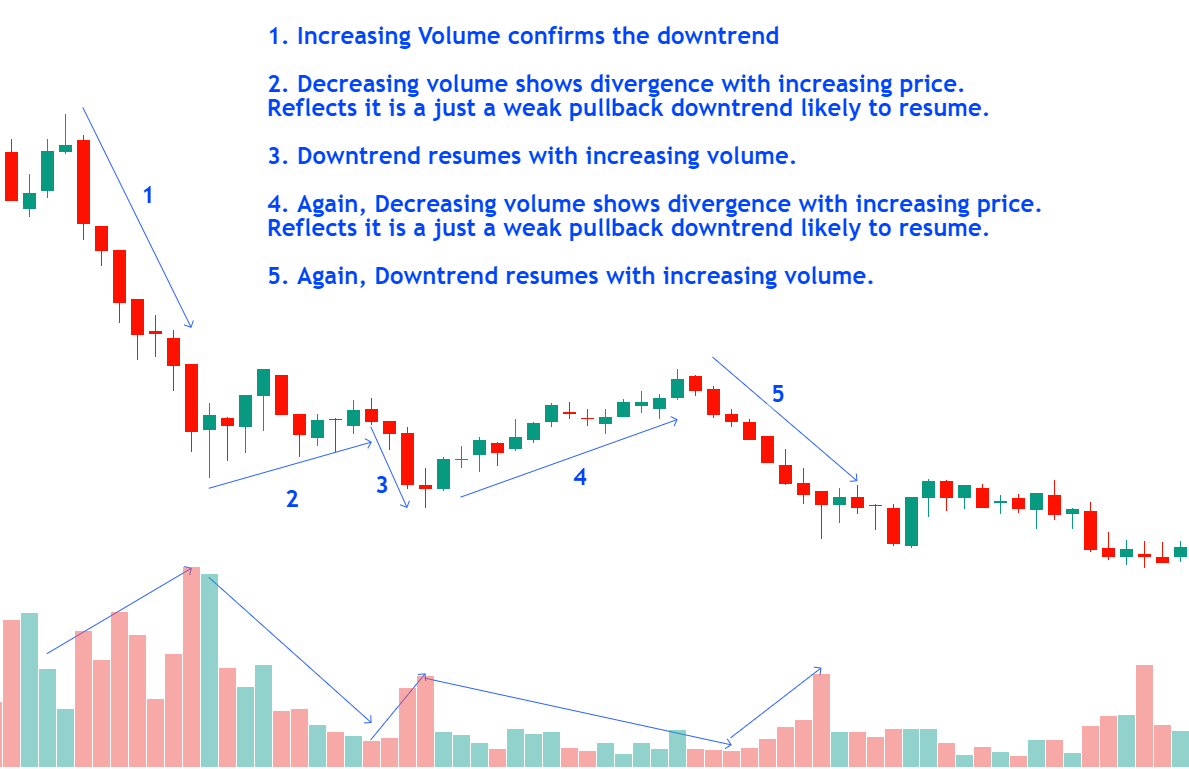
Volume Validation: Price swing 1, 3 & 5
Price is falling downward on high volume, this confirms the move, signaling genuine selling interest and likely continuation.
Volume Divergence: Price swing 2 & 4
Now, the price is rising, but volume is low. That is a red flag. It suggests a lack of conviction and weak pullback, meaning the move may not sustain and could reverse soon.
Understanding these two scenarios, validation or divergence is the foundation of Volume Price Analysis. Once you master this, the market starts making a lot more sense.
Principle No. 5: Reveals Battle Between Supply and Demand
Every trade in the market is a tug-of-war between supply (sellers) and demand (buyers). Volume is the direct evidence of that battle; it shows us who is actively participating and how strongly.
Let’s take the Hammer candlestick pattern as an example.
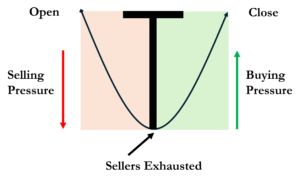
At first glance, you see the bullish price action, the long wick and small body but that alone does not tell you the full story. Is supply still stronger here, or is demand taking control?
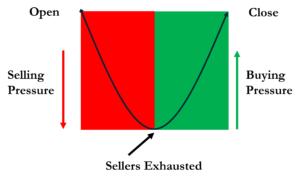
The truth is, you can not answer that question just by looking at the candle itself.
This is where volume comes in. Volume uncovers the real balance between buying and selling pressure inside each candlestick. It shows you whether that Hammer represents genuine demand stepping in or just a temporary pause before supply overwhelms the market again.
Till now, we have discussed Five Guiding Principles of Price Volume Analysis. One of the most crucial principles we covered was the fourth principle: Validation or Divergence. The idea is that volume should either confirm or contradict price movements.
Its time to discuss “How to do Price Volume Analysis” using individual candlesticks.
Volume Validation in Price Volume Analysis
Now, let’s take a look at some real examples of Validation based on single candlesticks. This is where things get really interesting because, once you understand how to read these signals, you’ll start seeing them everywhere on your charts.
Widespread Candle with High Volume
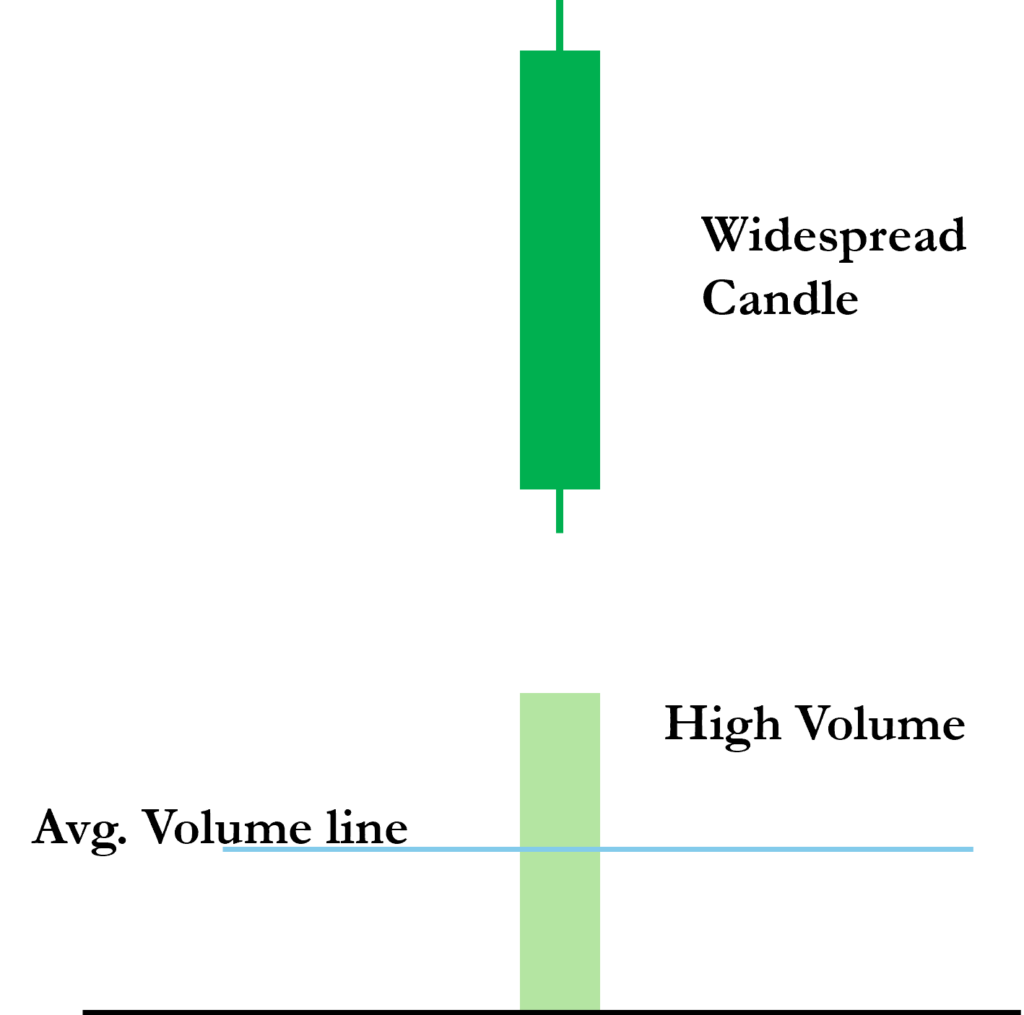
Take a look at above figure (imagine a widespread up candle with small wicks at the top and bottom). What’s happening here? The market is clearly bullish—it has risen strongly during the session and closed just below the high.
But the real question is:
Was this move genuine?
To answer that, we check the volume. And in this case, the volume is well above average.
Big price move = High effort = High volume (Validation)
This is exactly what we’d expect to see! It takes effort for the market to rise, and we can see that effort reflected in the strong volume. This is Wyckoff’s Law of Effort vs. Result in action.
Wyckoff’s third law tells us that it takes effort for the market to move—whether up or down. So, if this is a genuine bullish move, we should see a corresponding increase in volume. And guess what? The volume is well above average—exactly what we’d expect!
This tells us two very important things:
- The price move is real. It’s not some trick by market makers or a weak attempt to push the price higher. Instead, there’s strong participation—likely from big institutional players.
- The market is still bullish—at least for now. Since there’s no anomaly, we have no reason to suspect a reversal yet. If you’re holding a long position, this would be a sign to stay in the trade until the market gives you a reason to think otherwise.
Narrow Spread Candle with Low Volume
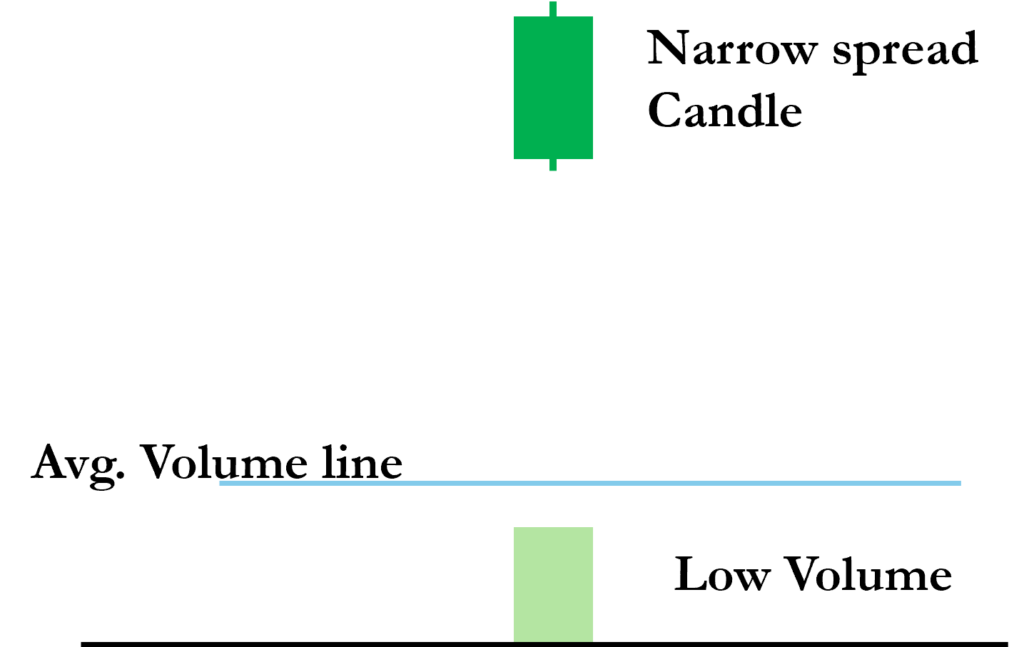
Now, let’s switch gears and talk about a different kind of price action—one that’s not as dramatic but still tells us a lot about the market.
Take a look at above figure (picture a narrow-spread candle with small wicks on both ends). What do you see? The price has moved up, but only slightly. The range of the candle is very narrow, meaning the market hasn’t really made much progress.
Now, let’s check the volume. It’s well below average. And here’s the million-dollar question:
Does the volume validate the price action?
The answer is yes! And the reason comes back to Wyckoff’s principle of Effort vs. Result.
Think about it this way: if the market has only moved up a little, that means there wasn’t much effort behind the move. And if there wasn’t much effort, we’d expect to see low volume—which is exactly what’s happening.
In simple terms:
Small price move = Small effort = Low volume (Validation)
This tells us that the market is behaving naturally. There’s no hidden agenda, no market manipulation—just normal price action that makes sense based on supply and demand.
But What Happens When Things Don’t Line Up?
Now, here’s where things get really interesting.
So far, we have seen examples where price and volume confirm each other. But what if they don’t?
- What if you see a big price move on low volume?
- Or a tiny price moves on massive volume?
That is when we are dealing with divergence. The key signs of market manipulation, potential reversals, or exhaustion moves.
And that is exactly what we are going to explore next.
Volume Divergence in Price Volume Analysis
Now, let’s take it a step further and discuss something equally fascinating: single candlestick divergence with volume. Have you ever looked at a price chart and thought, something just doesn’t add up? You see a strong price movement, but the volume doesn’t support it. That is exactly what we call candlestick divergence, when price action tells one story, but volume reveals the truth behind the story.
Widespread Candle with Low Volume
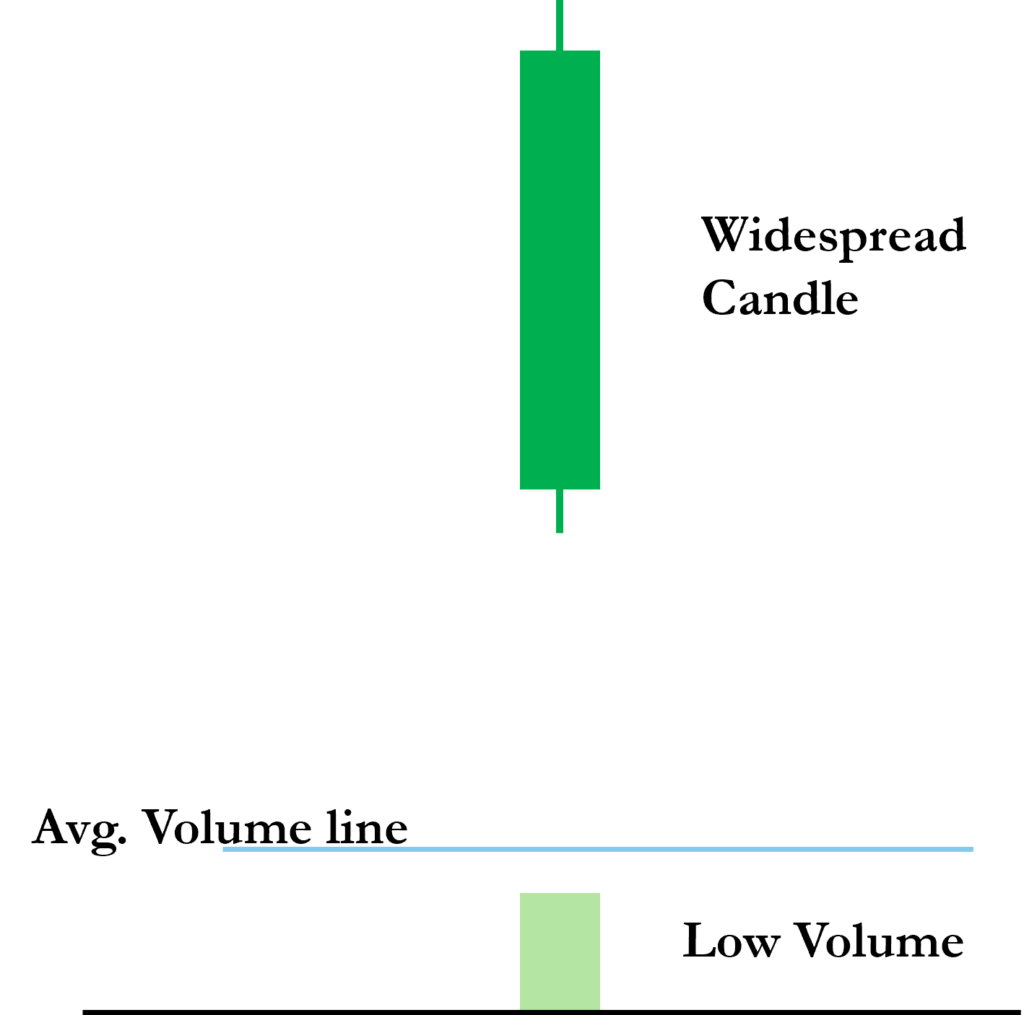
Let’s start with a common example. Picture this: you spot a widespread up candle, meaning the price has made a significant move higher. Now, following Wyckoff’s third rule, this kind of price action should be accompanied by equally strong volume—after all, big moves require big effort, right? But what if the volume is low?
That’s a red flag! A widespread up candle on low volume indicates a lack of genuine buying interest. It raises an important question: Why is there little volume when we should expect strong participation from buyers? Could it be a trap move orchestrated by market makers? Quite possibly.
Here’s how this plays out: imagine the market opens and pushes higher to test buyers’ interest. If the volume remains low, it means there aren’t enough real buyers stepping in. The price may soon reverse, catching those who bought into the move off guard. This scenario happens frequently, especially in the opening minutes of equity markets.
If you were holding a long position and saw this divergence, would you stay in the trade? Probably not. That is the power of volume analysis—it gives you an extra layer of insight that pure price action traders miss.
Narrow Spread Candle with High Volume
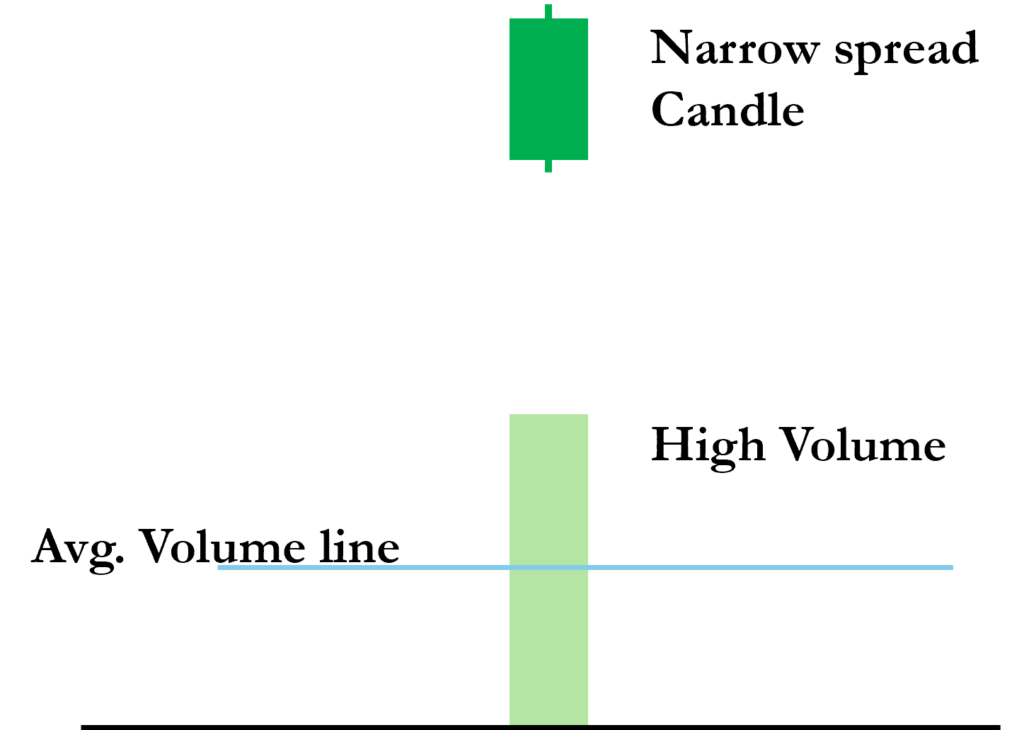
Now, let’s flip the scenario. You see a narrow-spread candle, meaning price barely moved, but the volume is exceptionally high. This, too, is a significant divergence.
Normally, when volume is high, we expect a wide-ranging candle, showing strong movement in one direction. But when a small price move comes with heavy volume, it signals weakness in the trend.
Think of it like trying to drive up a steep, icy hill. At first, you make progress, but soon, no matter how much power you apply, the car simply spins its wheels. Eventually, it stops and slides backward. That’s exactly what is happening in the market—the price is trying to push higher, but the effort isn’t yielding results. This usually signals that buyers are struggling, and a reversal may be on the horizon.
How to Use Price Volume Analysis in Trading
Ultra-High Volume
Ultra-high volume candles are landmark in Price Volume Analysis. They are not random events in the market. Instead, they often signal either the beginning of a major trend or the end of one, which is why they demand close attention from traders. The high and low of these candles frequently become significant reference points for future price action. When they appear near support or resistance, they act as an important alert signal for all traders.
But what exactly do we mean by ultra-high volume candles?
- Ultra-high volume indicates that a large number of bulls and bears are actively exchanging positions.
- In simple terms, it represents the presence of big money in the market. These are the footprints of smart money.
- Whether smart money is entering as buyers (bulls) or sellers (bears) is not immediately clear. The subsequent price action, combined with the candles spread and closing level, reveals the true intent behind the move.
How do we identify ultra-high volume candles?
As we discussed earlier, volume is always relative, not absolute. To spot ultra-high volume candles, traders often use volume moving averages as a benchmark.
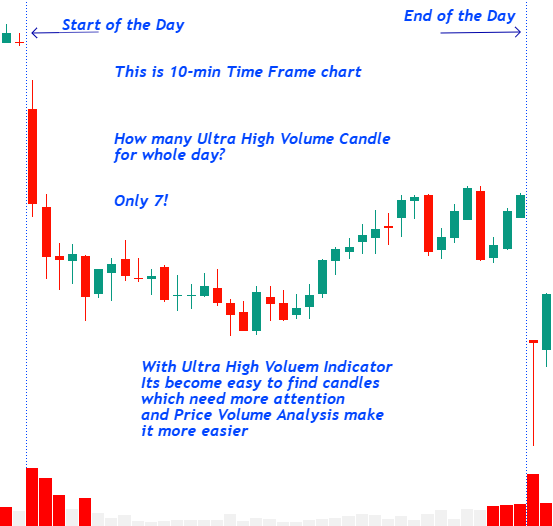
For example, in my own analysis, I use the 50-period EMA of volume. Any candle whose volume is at least 1.5 times higher than the 50 EMA volume qualifies as an ultra-high volume candle.
To make this distinction clearer on charts, I use color coding:
-
Red bars → Ultra-high volume (requires extra attention).
-
Light white bars → Normal volume (does not require special focus).
Note: Ultra high volume indicator setup in above chart is fully customized in TradingView Pine Script, and I have tailored it for my own trading to quickly spot ultra-high volume events.
Buying Climax & Selling Climax
A buying climax occurs when prices surge rapidly with massive volume, often marking the end of an uptrend. A selling climax is its opposite, panic selling at extreme volume often precedes a reversal.
“Climaxes are your best friends. They tell you where professionals changed sides.”
Note: These climaxes will discussed in later articles in details, stay tuned.
Volume as a Confirmation Tool
Volume is the lie detector of technical analysis. Chart patterns may look perfect, but without volume confirmation, they are unreliable.
- Breakouts: Must be backed by above-average activity. A breakout without volume is like smoke without fire.
- Pullbacks: If volume shrinks during a pullback, it’s healthy. If volume rises, it may be the start of a reversal.
- Reversals: Strong volume on reversal bars adds weight to the signal. Weak reversals without participation are suspect.
Note: We will discuss volume as a confirmation tool in Technical Analysis Series in details, stay tuned.
Trend Confirmation and Reversals
Rising prices with increasing volume confirm an uptrend. Falling prices with high volume confirm a downtrend. But if volume shrinks as price trends, be cautious—it may be losing steam.
Note: We will discuss this in Technical Analysis Series in details, stay tuned.
Identification of Strength or Weakness by Price Volume Analysis
As a trader, you know that there are three possible types of trends in the stock market: uptrend, downtrend, and sideways. For now, let’s set aside the sideways market, we will cover it in a later article using Price Volume Analysis.
Here, we will focus on identifying strength and weakness during an uptrend and downtrend.
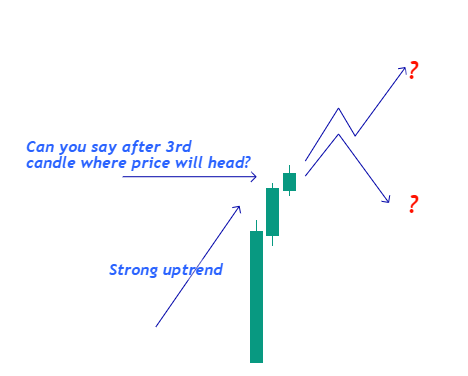
Let’s begin with the uptrend. When the market is in an uptrend, there are typically four key scenarios that can unfold. We will go through each of them one by one to understand how Price Volume Analysis helps in identifying the underlying strength or weakness behind the price movement.
- Increase in volume to price up-move

When we see increase in volume to the price up-move, it indicates that selling pressure is increasing. New bears are stepping in, attempting to satisfy the demand of the unsatisfied bulls and it led to an increase in volume.
- At this point, we cannot be certain if the bears will fully satisfy the remaining demand and reverse the trend.
- What we do know is that bearish pressure is building, which may set the stage for a potential reversal, subsequent price action to be followed up.
2. Decline in volume no reversal
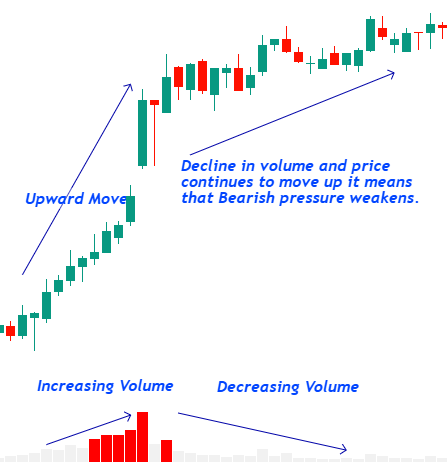
After a strong upward move with high volume, if we see a decline in volume and price continues to move up (no changes in price trend), it means that Bearish pressure weakens. Sellers are stepping back, the Bears are allowing the Bulls to ride the price up.
Similarly, after a strong downward move with high volume, if we see a decline in volume and price continues to decline (no changes in price trend), it means that Bullish pressure weakens. The Bulls are letting the Bears to push price down.
3. Decline in volume after reversal
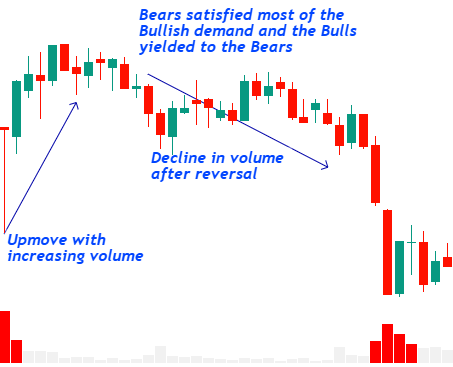
Following a high-volume up-move, if price starts to decline on lower volume, it means that the Bears satisfied most of the Bullish demand and the Bulls yielded to the Bears. The Bears won the fight.
Conversely, after a high-volume down-move, if price starts to move up on lower volume, it means that the Bulls covered the majority of the Bears’ supply and the Bears yielded to the Bulls. The Bulls won the fight.
4. Increase in volume after reversal
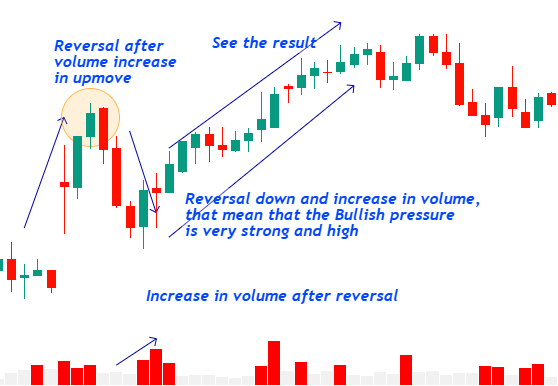
After a high-volume up-move followed by a reversal downward, if we have a reversal down and we see increase in volume, that mean that the Bullish pressure is very strong and high (even stronger). Bears must exert even more effort to overpower the bulls. The fight between Bulls and Bears continues. The Bears are stronger than the Bulls at this moment, yet, the Bulls are not ready to yield.
Similarly, after a high-volume down-move followed by an upward reversal, and we see further increase in volume, that mean that the Bearish pressure is strong and stronger Bullish pressure is required to beat the Bears. The fight between Bulls and Bears continues. The Bulls are stronger at this moment, yet, the Bears are not ready to yield.
As the old maxim goes: “Effort versus result—if effort is high but result is small, something is wrong.” High volume with little progress often means hidden supply is at work.
Common Mistakes in Price Volume Analysis
Even though price volume analysis is straightforward, many traders misuse it. Here are the most common mistakes:
- Treating all high volume as bullish.
High volume can mean demand, but it can also mean heavy selling. Without considering the candle’s spread and close, volume alone misleads. - Ignoring market context.
Volume during consolidation is different from volume during breakouts. Always judge in relation to market structure. - Forgetting that volume is relative.
A million shares in a small-cap stock is massive, but in a large-cap, it is normal. Always compare with historical averages. - Focusing on volume alone.
Volume tells part of the story; price action completes it. Volume must be read alongside price spreads and closes. - Overlooking timeframe differences.
A volume climax on a 1-minute chart may only matter to scalpers, but not to swing traders. Always align volume analysis with your trading horizon. - Chasing every volume spike.
Not all spikes matter. Distinguish between routine earnings-day surges and genuine institutional footprints.
The key is to read volume in context, not in isolation.
Final Thoughts
Price Volume Analysis is more than just looking at volume bars on a chart. it is about decoding Supply and Demand, identifying Signs of Strength or Signs of Weakness, and applying How to Read Price Action with market psychology. Price shows the effect, but volume reveals the cause. Volume preceeds with efforts followed by price with result on the chart. By combining both price and volume, traders can:
- Anticipate breakouts and reversals
- Confirm the strength of trends
- Detect smart money activity early
If you want to trade with confidence, make Price Volume Analysis a core part of your trading strategy.
Note: This article is part of Tradonomics’ Smart Money Secrets with Volume Price Analysis series. Explore it to unlock powerful trading insights and master Volume Price Action!