
In our previous discussion, we explored how to validate single candlesticks using volume. Now, let’s take it a step further and discuss something equally fascinating: single candlestick divergence with volume. Have you ever looked at a price chart and thought, something just doesn’t add up? You see a strong price movement, but the volume doesn’t support it. That’s exactly what we call candlestick divergence—when price action tells one story, but volume reveals the truth behind the story.
Widespread Candle with Low Volume
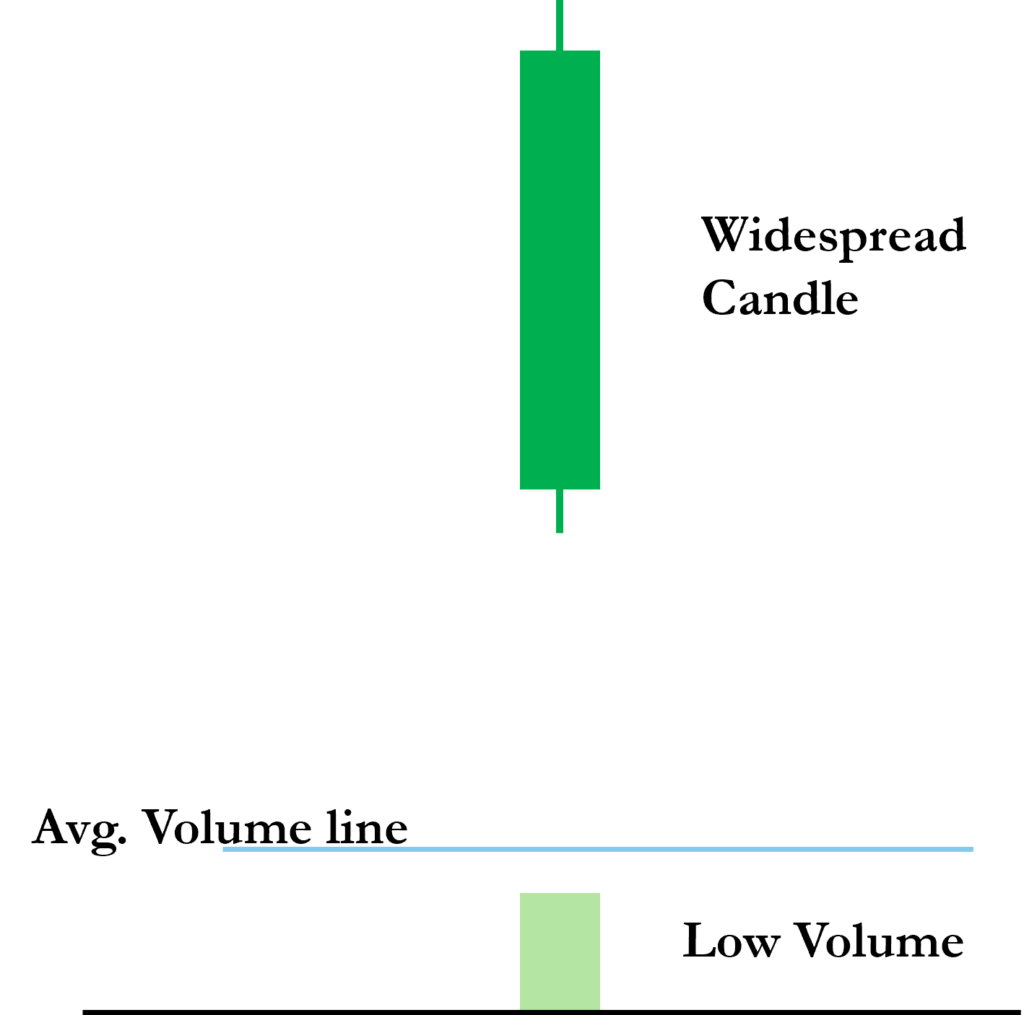
Let’s start with a common example. Picture this: you spot a widespread up candle, meaning the price has made a significant move higher. Now, following Wyckoff’s third rule, this kind of price action should be accompanied by equally strong volume—after all, big moves require big effort, right? But what if the volume is low?
That’s a red flag! A widespread up candle on low volume indicates a lack of genuine buying interest. It raises an important question: Why is there little volume when we should expect strong participation from buyers? Could it be a trap move orchestrated by market makers? Quite possibly.
Here’s how this plays out: imagine the market opens and pushes higher to test buyers’ interest. If the volume remains low, it means there aren’t enough real buyers stepping in. The price may soon reverse, catching those who bought into the move off guard. This scenario happens frequently, especially in the opening minutes of equity markets.
If you were holding a long position and saw this divergence, would you stay in the trade? Probably not. That’s the power of volume analysis—it gives you an extra layer of insight that pure price action traders miss.
Narrow Spread Candle with High Volume
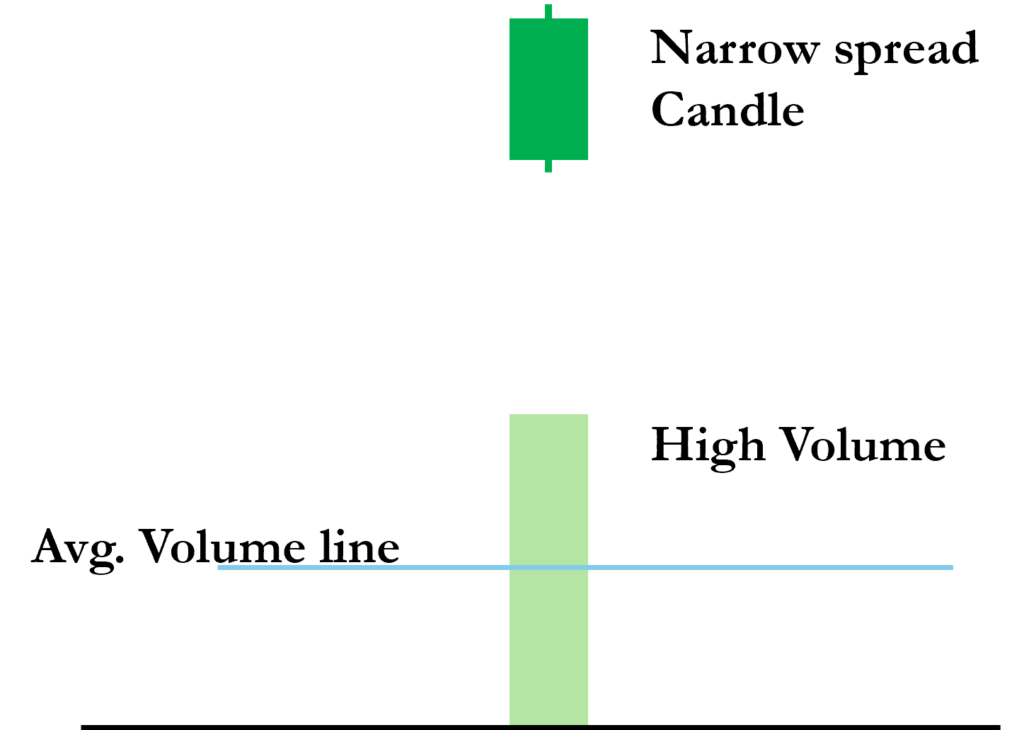
Now, let’s flip the scenario. You see a narrow-spread candle, meaning price barely moved, but the volume is exceptionally high. This, too, is a significant divergence.
Normally, when volume is high, we expect a wide-ranging candle, showing strong movement in one direction. But when a small price move comes with heavy volume, it signals weakness in the trend.
Think of it like trying to drive up a steep, icy hill. At first, you make progress, but soon, no matter how much power you apply, the car simply spins its wheels. Eventually, it stops and slides backward. That’s exactly what’s happening in the market—the price is trying to push higher, but the effort isn’t yielding results. This usually signals that buyers are struggling, and a reversal may be on the horizon.
Why Volume Tells the Truth
Volume is one of the few market indicators that cannot be manipulated easily. Unlike price, which can be moved by large players in the short term, volume reflects actual participation. That’s why combining candlestick patterns with volume analysis provides a clearer picture of market dynamics.
When you next analyze a chart, don’t just look at the candlesticks—check if the volume confirms or contradicts the move. If you see divergence, take a step back and ask: Who is really behind this move? The informed traders or the trapped traders?
By mastering this technique, you’ll start spotting traps, fake breakouts, and real trend shifts with much more confidence. Ready to put this into practice? Open up your charts and start looking for these volume divergences—you’ll be amazed at what you find!
Stay tuned! In the upcoming articles, we’ll dive into some of the most talked-about candlesticks—Hammer, Shooting Star, Inverted Hammer, Hanging Man, and Long-Legged Dojis. But here’s the twist—we won’t just look at their shapes; we’ll analyze them through the lens of Volume Price Analysis. Sounds interesting? Let’s explore these patterns together and uncover what they really tell us about market moves!
Note: This article is part of Tradonomics’ Smart Money Secrets with Volume Price Analysis series. Explore it to unlock powerful trading insights and master Volume Price Action!