
In the previous article, we discussed the Guiding Principles of Volume Price Analysis. One of the most crucial principles we covered was the third principle: Validation or Divergence—the idea that volume should either confirm or contradict price movements.
In this article, we’ll dive into real examples of validation with Price Volume Analysis using individual candlesticks.
Now, let’s take a look at some real examples of Validation based on single candlesticks. This is where things get really interesting because, once you understand how to read these signals, you’ll start seeing them everywhere on your charts.
Widespread Candle with High Volume
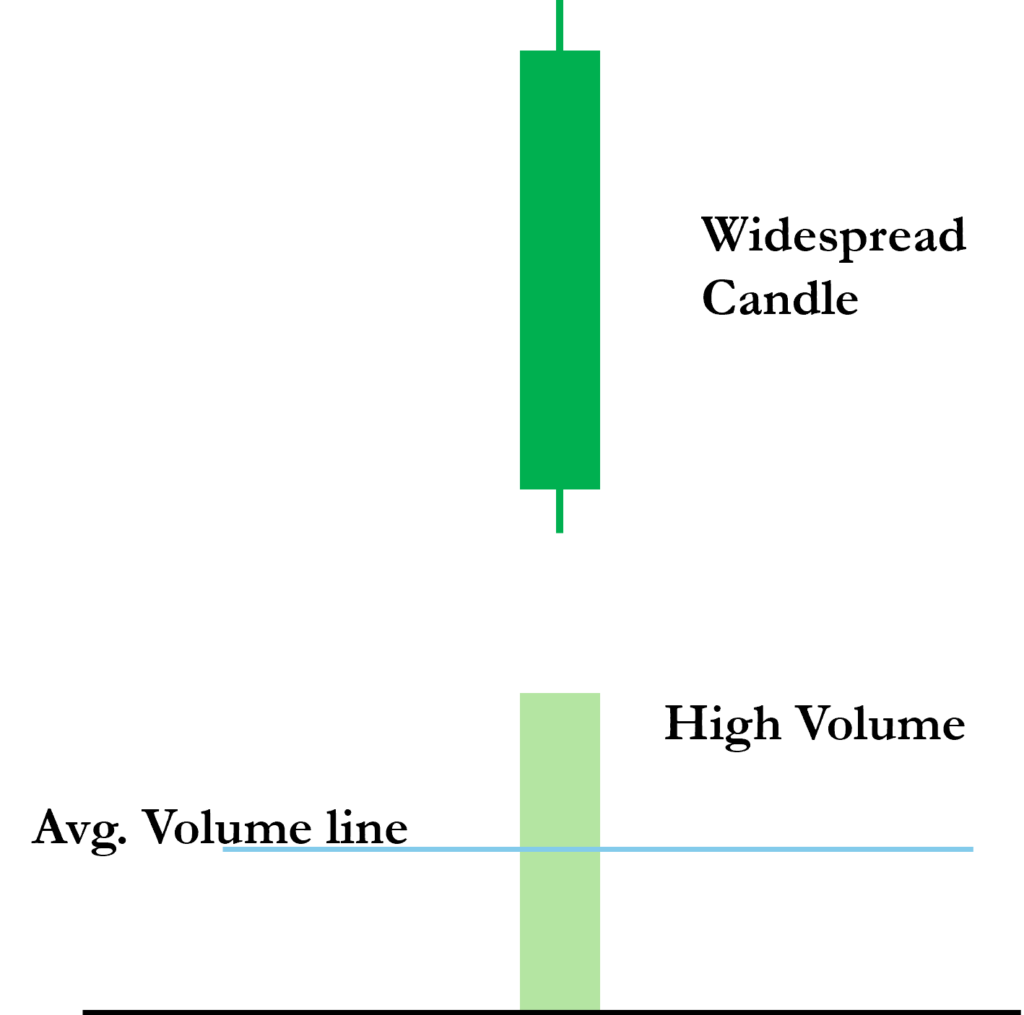
Take a look at Fig 1 (imagine a widespread up candle with small wicks at the top and bottom). What’s happening here? The market is clearly bullish—it has risen strongly during the session and closed just below the high.
But the real question is:
Was this move genuine?
To answer that, we check the volume. And in this case, the volume is well above average.
Big price move = High effort = High volume (Validation)
This is exactly what we’d expect to see! It takes effort for the market to rise, and we can see that effort reflected in the strong volume. This is Wyckoff’s Law of Effort vs. Result in action.
Wyckoff’s third law tells us that it takes effort for the market to move—whether up or down. So, if this is a genuine bullish move, we should see a corresponding increase in volume. And guess what? The volume is well above average—exactly what we’d expect!
This tells us two very important things:
- The price move is real. It’s not some trick by market makers or a weak attempt to push the price higher. Instead, there’s strong participation—likely from big institutional players.
- The market is still bullish—at least for now. Since there’s no anomaly, we have no reason to suspect a reversal yet. If you’re holding a long position, this would be a sign to stay in the trade until the market gives you a reason to think otherwise.
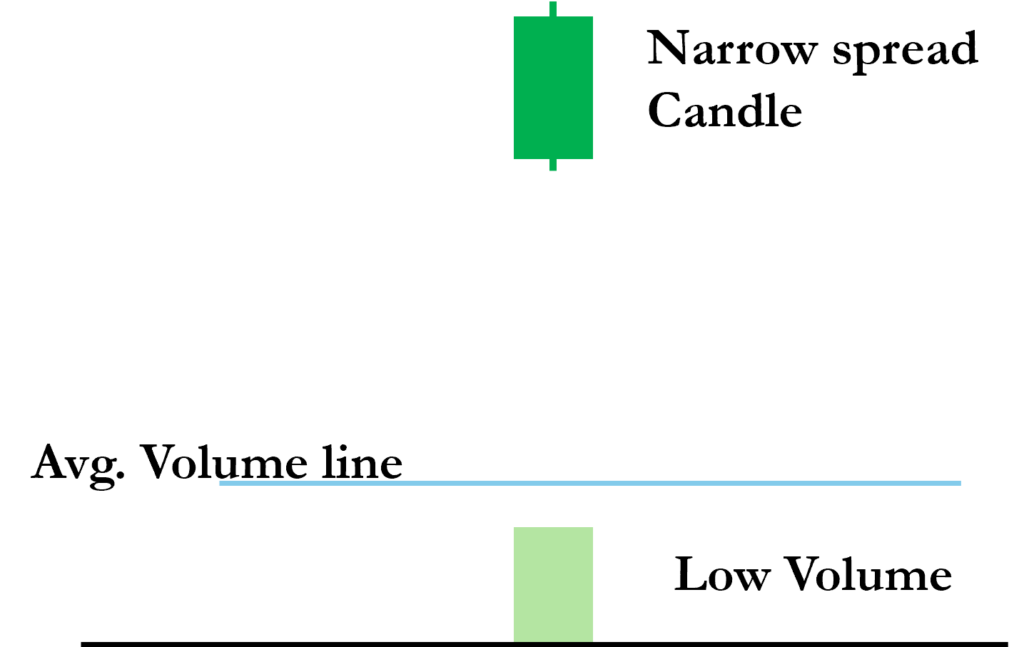
Narrow Spread Candle with Low Volume
Now, let’s switch gears and talk about a different kind of price action—one that’s not as dramatic but still tells us a lot about the market.
Take a look at Fig 2 (picture a narrow-spread candle with small wicks on both ends). What do you see? The price has moved up, but only slightly. The range of the candle is very narrow, meaning the market hasn’t really made much progress.
Now, let’s check the volume. It’s well below average. And here’s the million-dollar question:
Does the volume validate the price action?
The answer is yes! And the reason comes back to Wyckoff’s principle of Effort vs. Result.
Think about it this way: if the market has only moved up a little, that means there wasn’t much effort behind the move. And if there wasn’t much effort, we’d expect to see low volume—which is exactly what’s happening.
In simple terms:
Small price move = Small effort = Low volume (Validation)
This tells us that the market is behaving naturally. There’s no hidden agenda, no market manipulation—just normal price action that makes sense based on supply and demand.
But What Happens When Things Don’t Line Up?
Now, here’s where things get really interesting.
So far, we’ve seen examples where price and volume confirm each other. But what if they don’t?
- What if you see a big price move on low volume?
- Or a tiny price moves on massive volume?
That’s when we’re dealing with divergence—the key signs of market manipulation, potential reversals, or exhaustion moves.
And that’s exactly what we’re going to explore next.
In the next article, we’ll discuss Divergence on a single candlestick—stay tuned!
Note: This article is part of Tradonomics’ Smart Money Secrets with Volume Price Analysis series. Explore it to unlock powerful trading insights and master Volume Price Action!