
Have you ever wondered why prices move the way they do? If you have spent time staring at charts, trying to decode price action, then you are at the right place. In this article, we are going to explore the Wyckoff Laws, the foundation of Volume Price Analysis (VPA).
Once you grasp Wyckoff Laws and their impact on stock market trends, you’ll never look at the markets the same way again!
Who Was Richard Wyckoff?
Before we get into the nitty-gritty, let’s talk about the man behind it all. Richard Wyckoff was a pioneer in technical analysis, much like Charles Dow and Jesse Livermore. He spent years studying market behavior through ticker tape reading (imagine scrolling through endless price and volume data without modern charts—crazy, right?). His work, The Richard Wyckoff Method of Trading and Investing in Stocks, first released in the 1930s, is still a goldmine for traders today.
Wyckoff believed that technical analysis isn’t just about numbers—it’s an art. His core idea? Prices move due to supply and demand. Understand this relationship, and you can anticipate market direction with greater accuracy.
Sounds good? Great! Let’s break down his three fundamental laws of market behavior.
Wyckoff Law of Supply and Demand
Alright, let’s start with the basics: price moves based on the balance between supply and demand. It’s just like an auction—buyers and sellers place orders, and price moves accordingly.
How Supply and Demand Work in the Market
- Supply (Selling Pressure): Created when traders place sell orders.
- Demand (Buying Pressure): Created when traders place buy orders.
But here’s where many traders go wrong: not all sales are supply, and not all purchases are demand. Weird, right? It all comes down to how orders are placed:
- Passive Traders (Limit Orders): These orders sit in the order book but don’t move price directly.
- Aggressive Traders (Market Orders): These orders take liquidity and actually move price.
For price to move, aggressive traders must consume available liquidity at a given level:
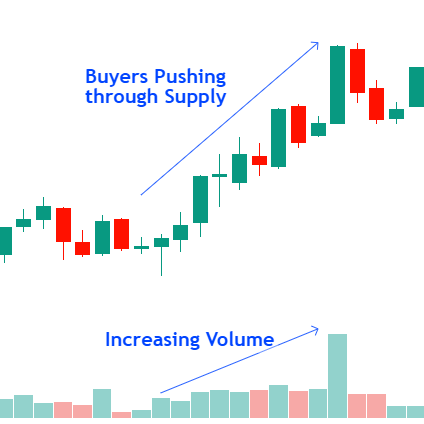
- Uptrend: Buyers clear out all sell orders and keep pushing up.
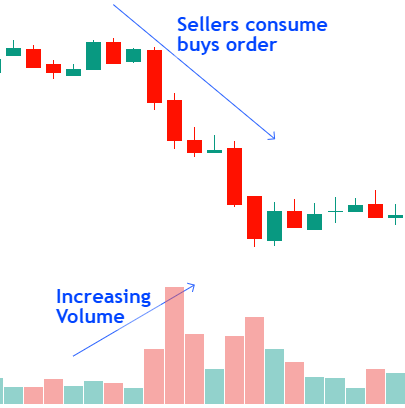
- Downtrend: Sellers consume buy orders and drive price lower.
While passive orders can slow down price movement, they do not cause shifts in price. Only market orders (aggressive buying or selling) can drive price movement.
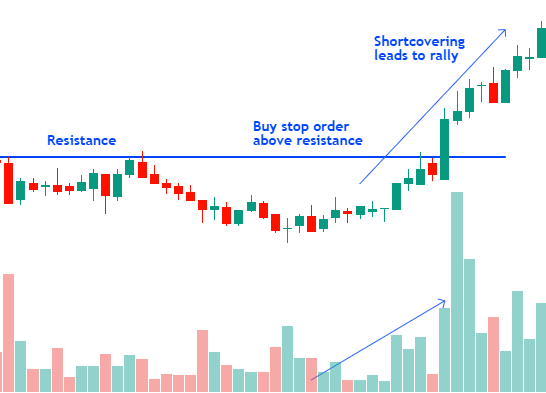
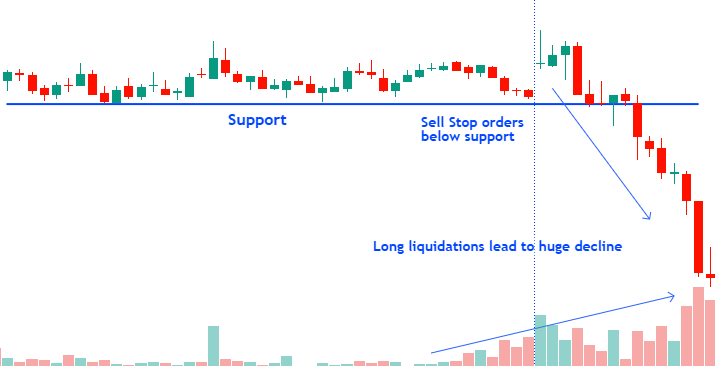
Additionally, stop-loss executions can trigger large moves:
- Short covering (buy stop-losses) can fuel a rally.
- Long liquidations (sell stop-losses) can accelerate a decline.
Ever noticed how price sometimes moves sharply even with little volume? That’s due to a lack of opposing interest:
- No new selling orders? Even small buying pressure can cause a rally.
- No new buying orders? Even minimal selling pressure can cause a decline.
How to Apply This in Trading
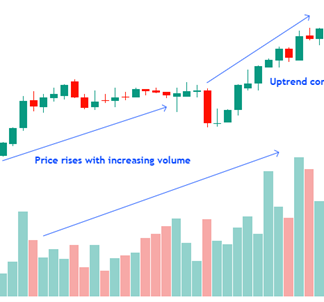
Wyckoff stressed that volume tells you the real story:
- Price rises with increasing volume? Strong demand—trend likely to continue.
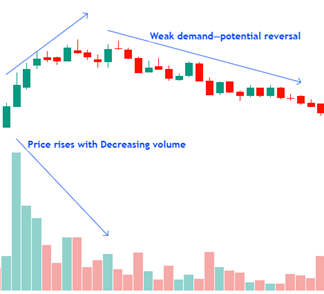
- Price rises with falling volume? Weak demand—potential reversal ahead.
- Price drops with increasing volume? Heavy selling—trend may continue lower.
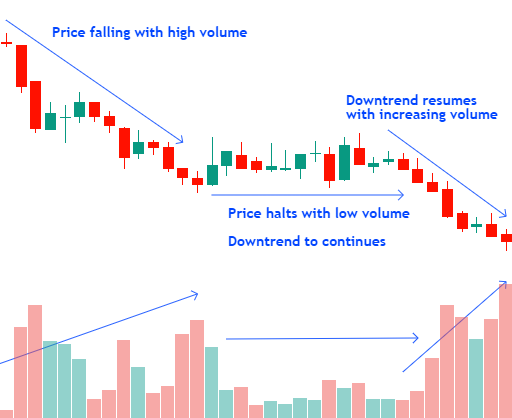
- Price drops with low volume? Lack of interest—possible exhaustion.
Quick Analogy:
Imagine a retail store during a seasonal sale. If there’s too much stock (high supply), prices drop to attract customers. If a product is in high demand, prices rise due to scarcity. Markets work the same way!
Wyckoff Law of Cause and Effect
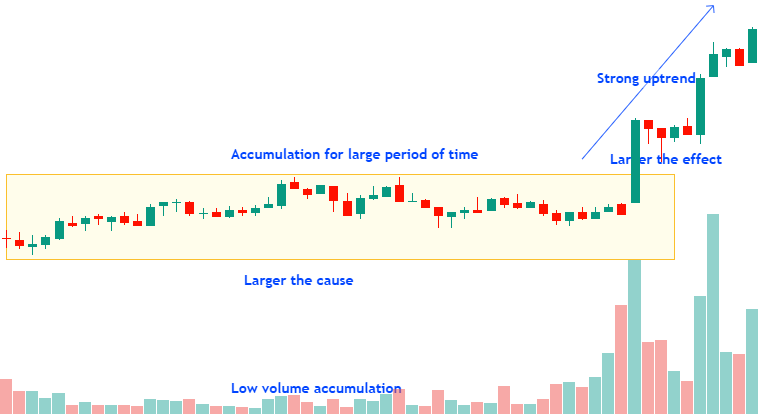
This one’s simple: before price makes a big move (effect), there must be an underlying accumulation or distribution phase (cause).
The size of the effect is directly proportional to the size of the preceding cause. Think of it this way:
- Big cause = Big effect
A large cause will lead to a large effect (strong price movement).
- Small cause = Small effect
A small cause will lead to a small effect (limited price movement).
Understanding Cause and Effect in Market Trends
Wyckoff identified Accumulation and Distribution as periods of cause-building, with the subsequent Markup or Markdown being the effect.
- Accumulation Phase (Cause): Smart money (institutions) gradually buy assets at low prices, absorbing supply while keeping the price relatively stable.
- Mark-up Phase (Effect): Once enough accumulation has occurred, demand surpasses supply, leading to a strong upward price movement (bull market).
- Distribution Phase (Cause): Institutions start offloading their holdings at high prices, distributing shares to the public.
- Mark-down Phase (Effect): After distribution, supply overwhelms demand, leading to a significant price decline (bear market).
Since a cause must precede an effect, traders can measure accumulation or distribution to anticipate the magnitude of the upcoming move.
Quick Analogy:
Imagine a dam holding back water. The longer water accumulates behind the dam (cause), the more powerful the flood when it is released (effect). Similarly, a long period of accumulation leads to a strong rally, while extended distribution results in a steep decline.
By spotting accumulation or distribution early, you can position yourself before the big move happens.
Wyckoff Law of Effort vs. Result
Ever heard of Newton’s Third Law? Wyckoff applied a similar principle to the markets:
“A price move should match the effort exerted (volume). If effort and result diverge, a market imbalance exists.”
- Effort = Trading volume
- Result = Price movement
If price moves significantly with strong volume, it confirms that the trend is valid. However, if price movement (result) doesn’t match the volume (effort), traders should investigate further.
Effort vs. Result Scenarios
- Effort (high volume) matches Result (strong price movement) → Healthy trend continuation.
- Effort (high volume) but small Result (weak price movement) → Hidden accumulation/distribution; trend may reverse.
- Low Effort (low volume) but strong Result (big price move) → Artificial movement due to lack of liquidity; likely unsustainable.
Let’s have an example below:
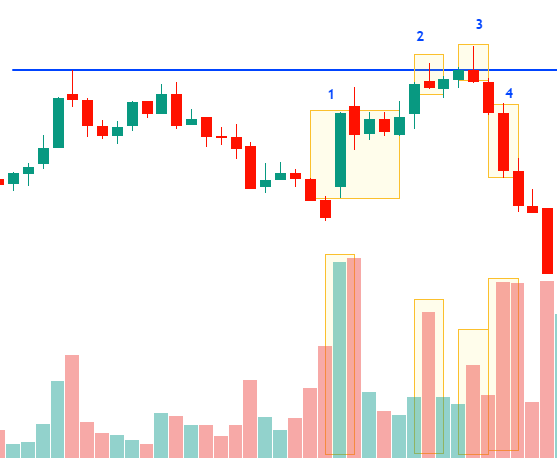
Candle-1: High volume matches with strong price movement; trend is likely to continue.
Candle-2: High volume with weak price movement, time to alert for a potential trap and likely trend reversal wait for confirmation.
Candle-3: Again, high volume with weak price movement and rejection candle confirms the trend reversal.
Candle-4: High volume matches with strong price movement; trend is likely to continue.
See, how amazing this is? Volume confirms what is happening behind the each and every candle. We will discuss volume price analysis in detail in later articles, this is just introduction of Wycoff law’s introduction.
This law helps traders spot harmony and divergences between price and volume, allowing them to identify trend continuation and potential trend reversals.
Quick Analogy:
Consider a car accelerating. If you press the accelerator hard but the car moves only slightly, there’s an issue—perhaps low fuel or a mechanical problem. In markets, if volume (effort) is strong but price doesn’t move much, it indicates hidden resistance or distribution by large players.
How to Apply Wyckoff Laws into Day Trading Strategies
Alright, you’ve made it this far—so how do you use all this?
Here’s how you integrate Wyckoff’s Laws:
By integrating these three laws, traders can better understand price movements and develop high-probability trading strategies:
- Identify accumulation & distribution phases to enter trades before trends begin.
- Analyze supply and demand shifts to confirm trend strength.
- Watch for effort vs. result discrepancies to anticipate reversals.
Integrating Wyckoff principles into day trading strategies allows traders to apply these laws in real-time, spotting key accumulation or distribution zones and using volume price analysis to make informed trading decisions.
Wyckoff’s principles remain a core part of modern technical analysis, used in price action trading and Volume Price Analysis (VPA). By applying these laws consistently, traders gain a deeper understanding of market movements and increase their trading edge.
Note: This article is part of Tradonomics’ Smart Money Secrets with Volume Price Analysis series. Explore it to unlock powerful trading insights and master Volume Price Action!