
In trading, some candles whisper while others scream. When a wide range bearish candle appears, it’s sending a loud message. But what exactly is it telling you?
In the previous article, we explored the Wide Range Bullish Candlestick in detail. Now, let’s shift our focus to the Wide range Bearish Candlestick and understand its significance in trading.
What Are Wide Range Bearish Candlesticks?
A wide range bearish candlestick is a large-bodied candle that stands out from the rest. It covers a significantly larger range compared to recent bars, often signaling strong selling pressure. While there’s no strict size definition, with experience, you’ll spot them easily on a chart.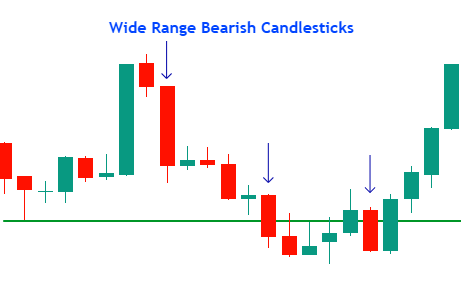
These candles typically indicate institutional activity. But before you get excited about shorting, remember: a wide range candle should never be analyzed in isolation.
Sounds simple, right? But not every wide range bearish candle is a ticket to profits. This is where Wyckoff’s principles and volume analysis come into play.
What Does a Wide Range Bearish Candlestick Really Indicate?
A big bearish candle means strong selling—at least, that’s what it seems. But is it real weakness, or just an illusion? Let’s break it down using Wyckoff’s Laws & Volume Price Analysis.
- The Law of Supply and Demand
- High Volume: If a wide range bearish candle forms with high volume, supply is clearly greater than demand. Institutions might be distributing.
- Low Volume: If the same candle appears with low volume, it could be a trap—price is dropping, but without real selling pressure.
- The Law of Cause and Effect
- If a strong bearish candle follows a period of distribution (sideways movement with increasing volume), it’s a sign of a valid breakdown.
- If a wide range candle appears randomly in a downtrend without prior distribution, it may be unsustainable.
- The Law of Effort vs. Result
- If price makes a strong move but volume is low, the effort (volume) doesn’t match the result (price move). Be cautious.
- If volume is high but the result is weak (small candle or rejection), buyers might be absorbing selling pressure.
“Let’s look at the chart. I marked 3 bearish candlesticks. We will discuss one by one.
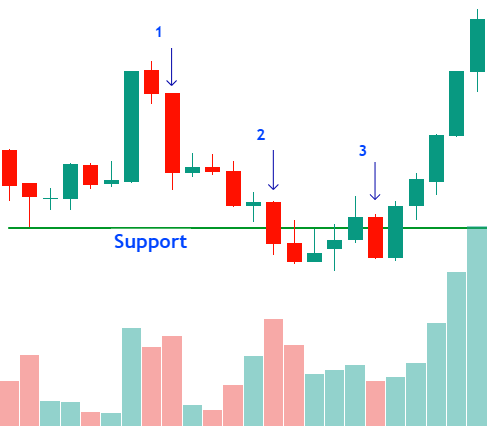
This chart highlights the importance of context and follow-through when interpreting bearish candlesticks.
- Candle-1: Clear bearish momentum with strong selling pressure.
- Candle-2: A deceptive breakdown—initially looks valid but is actually a liquidity trap by smart money. The inverted hammer signals potential reversal.
- Candle-3: A low-volume bearish candle, likely a test of selling pressure. The following bullish engulfing candle confirms buyers stepping in, leading to an uptrend.
This reinforces that a single bearish candle isn’t enough—understanding volume, Wyckoff’s principles, and the next moves is crucial.
How to Confirm Bearish Strength
So, how do you confirm if a wide range bearish candle is legit?
- Look at Volume – Is it above average? If yes, the move has real strength.
- Check Previous Structure – Did it break a key level? Was there distribution before?
- Observe the Next Candle – If the next candle confirms selling (lower close, strong follow-through), the move is likely real.
- Watch Context – Is it appearing at the start of trend or end of the trend? If, it is appearing at the start of the trend reveals the bearish pressure or at the end of the trend bullish pressure likely.
But what if volume doesn’t match the move?
When Wide Range Bearish Candlestick Become Traps
A big candle with low volume or ultra-high volume? That’s a warning sign—but context is key. Where a wide range candle appears determines whether it’s a genuine move or a trap set for retail traders before a reversal.
Classic Trap Scenarios
Selling Climax (SC):
- A wide range bearish candle with ultra-high volume after a prolonged downtrend can signal the end of the move.
- Institutions might be absorbing selling pressure and preparing for an upward reversal.
Testing Supply:
- A wide range bearish candle with low volume after an extended downtrend could be a final test to gauge remaining selling interest.
- If supply is weak, smart money may use this opportunity to push prices upward.
How Should You React?
Scenario 1: You’re Already in a Trade and See a Wide Range Candle with Weak Volume
- Consider taking profits or tightening your stop-loss—this move may not hold.
- Observe the next few candles: Are they confirming weakness, or is buying pressure increasing?
Scenario 2: You’re Not in a Trade but See a Wide Range Candle
- Don’t rush in! Let the market confirm the move.
- Check volume: Is it supporting the breakdown?
- Identify key levels: Did this candle break through a significant support zone?
Final Thoughts
The market always leaves clues. A wide range candle alone isn’t enough volume must confirm price action. Without it, what looks like a strong move could be a well-crafted illusion.
By applying Wyckoff’s principles along with Volume Price Analysis and truly understanding the market’s hidden motives, you can avoid traps and position yourself on the right side of the trade.
So, the next time you see a big candle, don’t just ask, “Is this a bearish signal?” Instead, ask: “Who is behind this move?”
Institutions? Or just a temporary illusion?
Master this, and you’ll decode the market’s loudest signals with confidence.
Note: This article is part of Tradonomics’ Smart Money Secrets with Volume Price Analysis series. Explore it to unlock powerful trading insights and master Volume Price Action!