
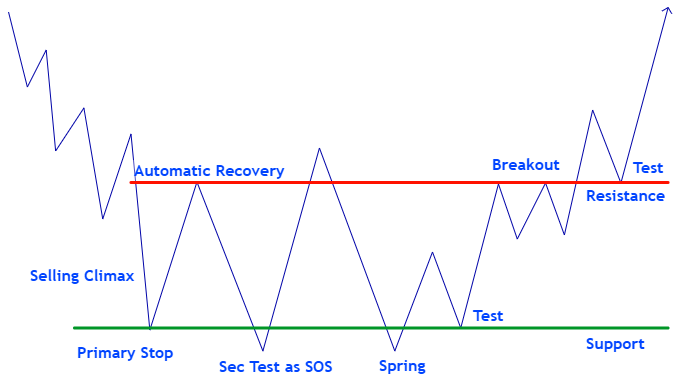
What is Wyckoff Accumulation?
Accumulation is a market phase that occurs after a strong downward move where institutional players fills their baskets at lower prices without moving price higher.
Once prices have fallen significantly, big professional traders often called strong hands begin to step in. Instead of buying everything at once (which would push the price up too quickly), they allow the market to move sideways in a range. During this time, the price doesn’t trend strongly in either direction it just consolidates within support and resistance levels.
Behind the scenes, these professionals are secretly buying (absorbing supply) from retail traders and weaker participants who are selling out of fear, panic, or impatience. Every time small traders sell their stock, professionals are there to quietly take the opposite side and build their positions.
The goal of accumulation is simple:
- Strong hands want to gather as much stock as possible at low prices.
- Once they control the majority of supply, the selling pressure dries up.
- When demand returns, even a small amount of buying can push the price upward very quickly.
Wyckoff Accumulation Example
Let’s understand Wyckoff Accumulation with an example:
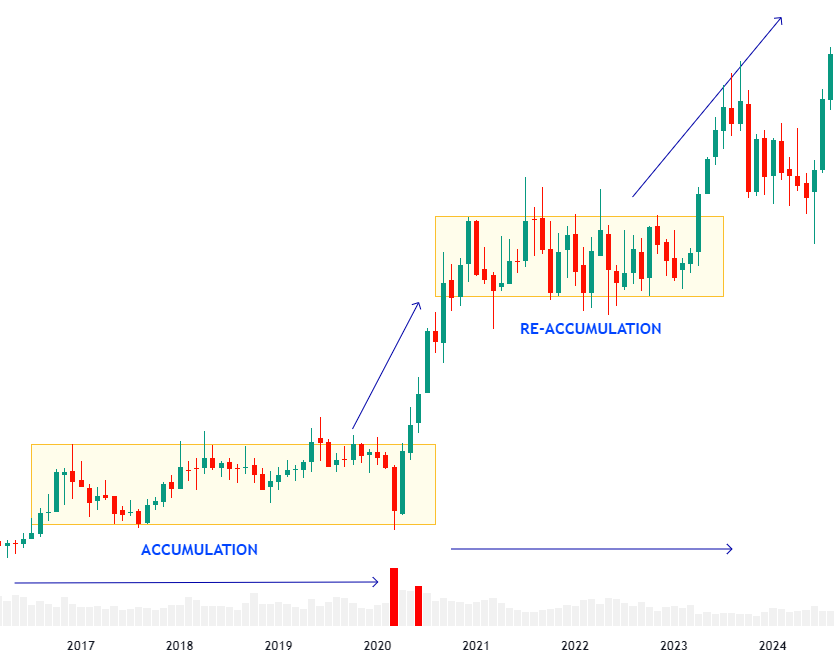
In the chart above, the stock traded in a sideways range for about 4 years. This long period of consolidation represents the cause (accumulation phase), which builds a strong foundation for the next bullish trend — the effect. The principle here is simple: the larger the cause, the larger the effect.
After the strong uptrend, the stock again entered a sideways range for about 2 years. This phase is known as re-accumulation, where professional traders accumulate more shares to support the continuation of the trend.
Once this re-accumulation phase is complete, the stock breaks out again into a powerful uptrend. At these much higher prices, professionals gradually distribute (sell) their previously accumulated shares, securing profits from the difference between their low entry prices and the elevated exit prices.
Let’s understand the trading psychology of Wyckoff Accumulation Phase in detail:
Stock Control From Weak Hands to Strong Hands
Before accumulation, during the bearish move (price falling), most of the stock is held by weak hands (retail traders). For the market to turn around, big professional traders (the strong hands) need to take control of this stock.
As the price keeps falling, more and more stock shifts into the hands of strong traders. The final part of this process happens inside the accumulation range, where strong hands finish absorbing all the stock. Once this is done, the price is ready to move upward.
The Law of Cause and Effect
In trading, the law of cause and effect means:
- Cause = something that builds up first.
- Effect = the result that follows.
In accumulation, the cause is the buying (stock absorption). The effect is the bullish trend that follows. The bigger the cause (the more time and effort spent absorbing stock), the stronger and longer the effect (the upward trend).
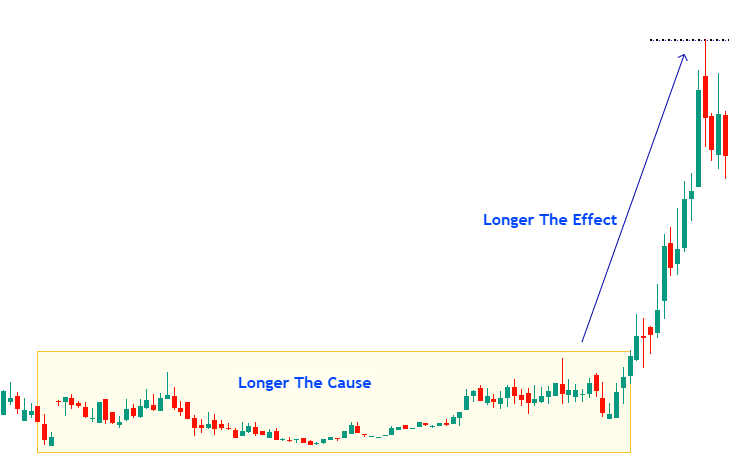
When you look at a chart that a longer period of accumulation often leads to a stronger and sometimes parabolic uptrend. This happens because large institutional traders cannot buy all their positions at once and doing so would immediately push prices higher against them.
Instead, they accumulate gradually, buying slowly and strategically over time. This careful process allows them to keep the average entry price low while avoiding unnecessary price spikes.
Market Manipulation in Accumulation
During accumulation, big traders create an environment that looks very weak. News will usually be bad, and many retail traders get trapped on the wrong side.
A common event in this phase is the bearish shakeout (also called a Spring or stoploss hunting). This is when the price suddenly drops below the support of the range. The purpose of this move is threefold:
- To hit the stop-loss orders of traders who were long (holding position).
- To trick uninformed traders into selling, thinking the downtrend will continue.
- That allow big traders to buy even more stock at lower prices.
This Spring often makes the bullish case stronger, but it doesn’t always happen. Sometimes the market turns up without a Spring this is harder to spot but still valid.
Big traders also need to remove weak hands (traders who sell quickly for small profits). To discourage them, professionals often create a flat, boring market, which pushes weak buyers to exit their trades.
Counterparty & Liquidity Through Stop-Loss Hunting
Big traders need sellers so they can buy. Liquidity comes from:
- Hitting stop-loss orders of buyers (which creates sell orders).
- New short sellers entering (also sell orders).
All of these sales provide the counterparty that professionals need for their buying.
Later, when the price rises back into the range, the stops of those short sellers get triggered, which adds even more buying power and strengthens the move up.
The Path of Least Resistance
Big traders will only start the uptrend once they know the path of least resistance is upwards. To test this, they push the price down slightly to see if sellers show up.
- If there’s low volume, it means sellers are weak, and the way up is clear.
- That’s why sometimes there are multiple shakeouts (Springs) inside the range they are just tests to confirm sellers are gone.
Common Characteristics of Wyckoff Accumulation Ranges
Here are the main signs of an accumulation phase:
- Falling volume and volatility – less stock is available to sell, so price moves shrink.
- Tests of the range high with low volume – shows sellers aren’t interested, unless price is ready to break out.
- Springs (shakeouts) at previous lows – either near the support level or smaller lows inside the range.
- Stronger upward moves than downward moves – shows quality demand is entering, while supply is weak.
- Higher highs and higher lows forming – usually happens in the final stage before the breakout, confirming buyers are fully in control.
Beginning of The Bullish Movement
Once strong hands finish absorbing stock, the market turns. Now, only they hold the stock, and they will only sell at much higher prices.
Even a small increase in demand at this point can trigger a sharp upward movement, starting the new bullish trend.
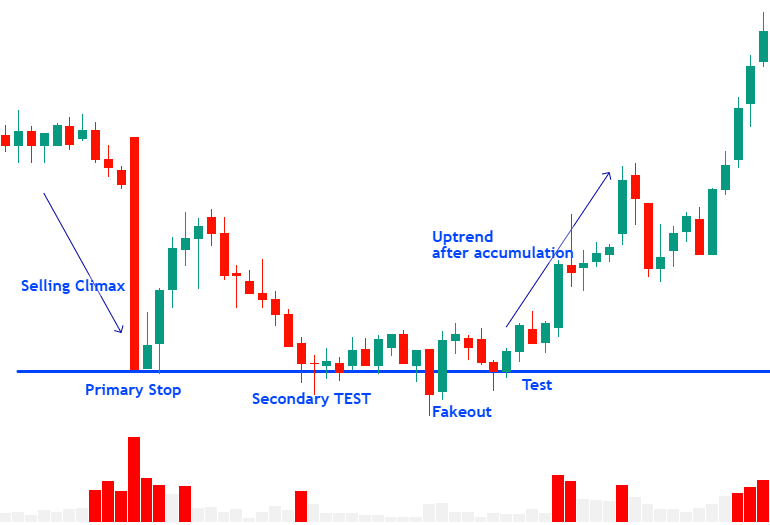
Lets understand Wycoff Accumulation in Nifty Futures chart (10-min, 25.07.25)
-
Downtrend Phase
Before Wycoff Accumulation begins, Nifty is in a steady downtrend with slow movement. This is typical because the market needs to create pessimism and shake out early buyers before smart money can step in. -
Selling Climax (SC)
Suddenly, a selling climax appears large-bodied bearish candles with ultra-high volume.- Retail traders panic and sell out of fear.
- But such extraordinary volume cannot be generated by retailers alone — this is where institutional players are stepping in.
- At this stage, positions are being transferred from weak hands (retail) to strong hands (institutions).
-
Automatic Rally / Primary Support (AR / PS)
After the climax, demand finally overcomes supply. Nifty bounces upward, marking the Primary Support (PS) area.- This level becomes the “wholesale price zone” where institutions prefer to accumulate.
- Institutions start filling their positions here, but they need time and liquidity, so they don’t allow the market to shoot up immediately.
-
Testing, Shakeouts & Stop Hunting
In the PS area, smart money uses manipulative tactics to accumulate quietly:- Testing: Pushing prices down to check whether selling pressure still exists.
- Stop Hunting / Shakeouts: Forcing weak traders to exit by triggering their stop-losses.
- This ensures institutions can keep buying at lower levels without moving the market too quickly against themselves.
-
Completion of Wycoff Accumulation & Uptrend Begins
Once the “big players’ baskets are full,” the pattern of tests and shakeouts reduces.- A minimal demand phase transitions into a strong uptrend.
- This marks the start of the markup phase, where institutions finally allow prices to rise, often leaving retail traders behind.
How to Trade Wyckoff Accumulation Pattern in Day Trading
The Wyckoff Accumulation Pattern is widely used by institutional players regardless of time frame whether in day trading (5-min, 15-min charts) or long-term investing (daily, weekly charts).
Institutions need to build large positions at low prices without moving the market too quickly. To do this, they accumulate gradually inside a sideways range, known as the accumulation phase. This process repeats across all timeframes from minutes to months.
Identifying Wyckoff Accumulation on Intraday Charts
On Intraday timeframes (like 5-min, 15-min, etc.), here is how to spot it:
- Sharp Drop First: Look for a strong bearish move (selling climax) before the range begins.
- Sideways Range Forms: Price stops trending down and moves sideways.
- Volume Decline: Volume gradually decreases inside the range (less selling pressure).
- Spring / False Breakdown: Price dips below support briefly to trap shorts & trigger stops.
- Test with Low Volume: Price retests support with reduced activity confirms sellers are gone.
- Signs of Strength: Higher lows, wider bullish bars, and stronger upward moves before breakout.
Day Trading Entry Strategy:
Here are the common entry strategies (we’ll expand each in detail later):
- Aggressive Entry: Enter at the Spring (false breakdown), with stop-loss just below the Spring low.
- Conservative Entry: Wait for the Test after the Spring; enter when price holds support with low volume.
- Breakout Entry: Enter on the Sign of Strength (SOS) or Last Point of Support (LPS) when price shows wide bullish bars and strong volume.
Why Wyckoff Accumulation Pattern Works in Day Trading
- Accumulation isn’t just a long-term concept it exists in every timeframe.
- On intraday charts, this gives traders a blueprint for spotting where institutions are building positions before a breakout.
- By aligning entries with Springs, Tests, and SOS, day traders can join the smart money move early with tight stop-losses and high reward-to-risk setups.
Note: This article is part of Tradonomics’ Smart Money Secrets with Volume Price Analysis series. Explore it to unlock powerful trading insights and master Volume Price Action!