
Have you ever noticed how a trade looks perfect on a lower time frame chart, but the moment you enter, the market flips against you? That usually happens because you are looking at the market from just one angle. Multi-timeframe analysis solves that problem. That’s why knowing how to do multiple timeframe analysis becomes so important.
What is a Multiple Timeframe Analysis
Multiple timeframe analysis is the process of analyzing a chart using more than one timeframe. Instead of looking at a chart only through a single lens, we examine it through different levels of zoom in & zoom out.”

Think of it this way: the higher timeframe is like zooming out with a drone. It shows you the bigger trend, the overall market structure, and those key levels that actually matter. Then, when you drop down to the lower timeframe, you get the precision that cleaner entry and exit points.
Now, imagine you only rely on the lower chart. A breakout on the 5-minute chart may look like the start of a strong move, but on the hourly chart, it could just be noise trapped inside a consolidation zone. That’s where traders get tricked.
By combining multiple timeframes, you filter out the weak setups, avoid jumping into random moves, and align yourself with the real momentum. It is like trading with both a map and a compass. You know the bigger direction and the exact spot to step in.
In the end, multi-timeframe analysis isn’t just about adding extra charts. It is about seeing the full story, cutting down mistakes, and trading with more confidence. And honestly, that’s what separates a shaky trade from a high-quality one.
How Many Timeframes Should I Use
The challenge for us is that the market is composed of numerous participants, all operating on different timeframes. So, which timeframes should we choose for our analysis?
The number of timeframes you use depends on your experience and comfort level. Some traders attempt to monitor five or six charts at once weekly, daily, hourly, down to one-minute. Their attempt to gain a complete picture is impressive, but for me, it’s simply too much data for one person to absorb during the development phase, at least until they’ve learned what to filter out.
On the other hand, I’ve seen traders attempt to operate using only one timeframe, in an effort to limit the information they must process. Personally, I think this is preferable to using too many timeframes. I can certainly trade this way, mostly because I’ve trained myself to recognize higher timeframe structure within lower timeframe data.
That said, my preference and certainly what I recommend for all traders while still learning is to operate with three timeframes.
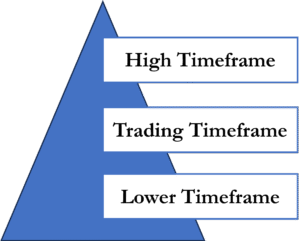
Higher Timeframe
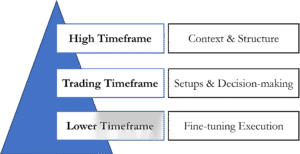
The higher timeframe places a structure or framework over the market. Through identification of support and resistance areas, we can locate zones that will act as barriers to trading timeframe price swings. In other words, we’ve defined our battlefield.
Trading Timeframe
The trading timeframe is where we actually trade hence the name. Our goal is to trade the swings within this timeframe, regardless of whether the market is trending or ranging sideways. We do this by:
- Understanding past price movement.
- Assessing the strength or weakness of that movement.
- Determining the likely path for future price action.
Lower Timeframe
The lower timeframe provides finer detail, helping us zoom in to see the internal forces of supply and demand. It also allows us to precisely time our entries and exits.We trade on the trading timeframe. But we always do so while placing this price action within the context of the higher timeframe structure.
For example:
- A trend on the trading timeframe may simply be a price swing within a higher timeframe sideways market. Multiple timeframe analysis keeps us alert to potential trend reversals at key higher timeframe barriers.
- A breakout through resistance on the trading timeframe may actually just push us deeper into a higher timeframe resistance zone. Here, we watch carefully for signs of breakout failure by tracking shifting bullish and bearish sentiment.
In essence, multiple timeframe analysis is all about placing trading timeframe market action within the context of the bigger picture, higher timeframe action.
Multiple Timeframe Analysis for Day Trading
When it comes to day trading, multiple timeframe analysis is not just helpful, it is essential. Intraday price action can move fast, and if you are only focused on one chart, you will often end up reacting to noise rather than market structure.
So, how do I personally approach it?
Let’s break it down:
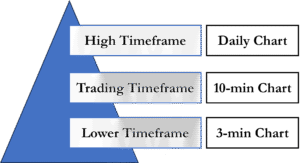
- Daily chart as the higher timeframe:
This is always where my pre-market preparation starts. The daily candle shows the full story of the previous session. It gives me a clean view of the broader trend, major support and resistance zones, and overall market context. Without day timeframe chart analysis, I feel like I am trading blind. That is why during live trading, I always keep the daily chart open. It reminds me where price really sits in the bigger picture, no matter what’s happening on the smaller charts.
- 10-minute chart as the trading timeframe:
This is where I actually look for trading setups, intraday swings and candlestick patterns (i.e. Bullish engulfing, bearish engulfing, shooting star, hammer & hanging man etc.). Why 10 minutes? Because it compresses the session into roughly 38 candles, which makes it possible to study each candle in real-time without being overwhelmed. It keeps me focused on meaningful movements instead of every small fluctuation.
- 3-minute chart as the execution timeframe:
Here’s where precision comes in. Once my 10-minute chart shows a setup that aligns with the daily bias, I drill down into the 3-minute to fine-tune my entry and exit. It helps me catch better risk-to-reward trades without losing sight of the bigger picture.
By aligning these three timeframes, I avoid the temptation of overtrading and chasing ticks on the lower charts. Instead, every trade I take has both context (from the daily), clarity (from the 10-minute), and precision (from the 3-minute). That balance keeps me disciplined during fast-moving intraday sessions.
How to do Multiple Timeframe Analysis
By now, you understand what Multiple Timeframe Analysis (MTA) is and which timeframes to use. The next step is learning how to apply it effectively.
Here is a step-by-step approach:
- Start Pre-market Analysis with the higher timeframe
Think of the higher timeframe as your market compass. It shows you the broader trend, key support and resistance zones, and whether the market is trending or consolidating. These levels define your battlefield and keep you from trading blindly.Keep the daily chart open during live trading to stay anchored to the bigger picture. (In upcoming articles, we’ll cover how to do a detailed pre-market analysis using daily charts.) - Move to the Trading Timeframe
This is your main working timeframe, used both for pre-market analysis and live trading.
-
- Before the market opens, use it to study price action, trend strength, and how the market behaved on the previous day.
- During live trading, analyze swings with volume price analysis within the higher timeframe’s structure. Watch for momentum alignment, retracements, and strength or weakness in moves. This step helps you form a clear bias and anticipate the most probable direction.
- We haven‟t yet covered analysis of trends, nor the creation of our higher timeframe S/R structure, so just accept the flow multiple timeframe analysis for now. (In upcoming articles, we’ll cover how to do a detailed each timeframe analysis.)
- Check the lower timeframe when needed
Once price reaches a key area, briefly switch to a lower timeframe to watch supply and demand more closely. This allows you to refine entries and stop placements with precision.
Avoid getting stuck on the lower timeframe, it can distract you. Only use it when price is at an important level and you need sharper timing for entry or exit.
- Execute only on the trading timeframe
Entries and exits should always be executed on your main trading timeframe. The higher timeframe provides context, the lower timeframe provides refinement, but your trading timeframe keeps you disciplined and consistent.The key is that each timeframe has its own role.
The Danger of Over-Focusing on the Lower Timeframe
One common danger I see when traders attempt to manage multiple timeframes is allowing their focus to get caught up in the detail of the lower timeframe.
I completely understand the temptation. The lower timeframe is where all the action seems to be happening. It’s fast. It’s exciting. Every tick feels important.
And yes, if the market is flowing smoothly, it may work out well to take every lower timeframe trigger. But often, this excessive focus on the lower timeframe becomes a recipe for overtrading. Sure, you’ll catch the good trades. But you’ll also find yourself entering into quite a few mediocre trades—ones that were never in a strong setup location on the trading timeframe chart.
If you notice this happening in your own trading, here’s a simple solution:
- Minimize your lower timeframe chart even I say don’t use lower time frame.
- Keep it hidden to protect your focus on the trading timeframe.
- Only open the lower timeframe chart when it’s genuinely required to fine-tune your analysis or when price has moved into a pre-identified trading timeframe setup area.
At all other times, keep the lower timeframe out of sight. This ensures your attention remains where it truly belongs on the trading timeframe and its setups, within the context of higher timeframe structure.
Is Multiple Timeframe Analysis Useful for Traders?
Yes. Multiple timeframe analysis is one of the most practical and powerful methods for traders at all levels. It prevents you from getting caught up in the noise of a single chart and ensures you don’t lose sight of the bigger picture.
For example:
- A breakout on your trading timeframe might look strong, but MTA helps you see if that move is actually pushing straight into a higher timeframe resistance zone, where failure is likely.
- A small trend on your trading timeframe may simply be part of a sideways consolidation on the higher timeframe, warning you not to expect it to extend too far.
In short, MTA keeps you aligned with broader market forces while still allowing you to act with precision.
Does Multiple Timeframe Analysis Improve Profitability in Trading?
Multiple timeframe analysis itself doesn’t magically make you profitable. Profitability comes from disciplined execution, risk management, and emotional control.
However, MTA does improve the quality of your trades, because it:
- Filters out poor setups that only look good on one chart but fail in the bigger context.
- Helps you anticipate potential reversals at key higher timeframe barriers.
- Provides precise entry and exit opportunities when combined with lower timeframe detail.
By aligning your trading timeframe setups with higher timeframe structure, you increase the probability that your trades are positioned with the dominant flow of the market. Over time, this improved selectivity and timing can absolutely contribute to better consistency and profitability.