
At first glance, a Hanging Man candle may seem like a sign of strength. After all, it looks almost identical to a Hammer—a long lower wick with a small body near the top of the range. But here’s the critical difference: context.
A Hammer forms after a downtrend, signaling a potential reversal to the upside. A Hanging Man, on the other hand, appears at the top of an uptrend, and that makes all the difference. Instead of strength, it’s flashing a warning sign—a potential shift from bullish to bearish momentum. 
Let’s dive deep into what the Hanging Man tells us and how you can use it to stay ahead of the market.
What does a hanging man candlestick indicate in the stock market?
Price Action: A Warning Signal in a Bullish Trend
Imagine you’re watching a stock or an index that’s been steadily climbing. Bulls are in control, pushing the price higher, and everything seems great.
Then, one day, something interesting happens:
The price suddenly drops during the session, only to recover and close near the open.
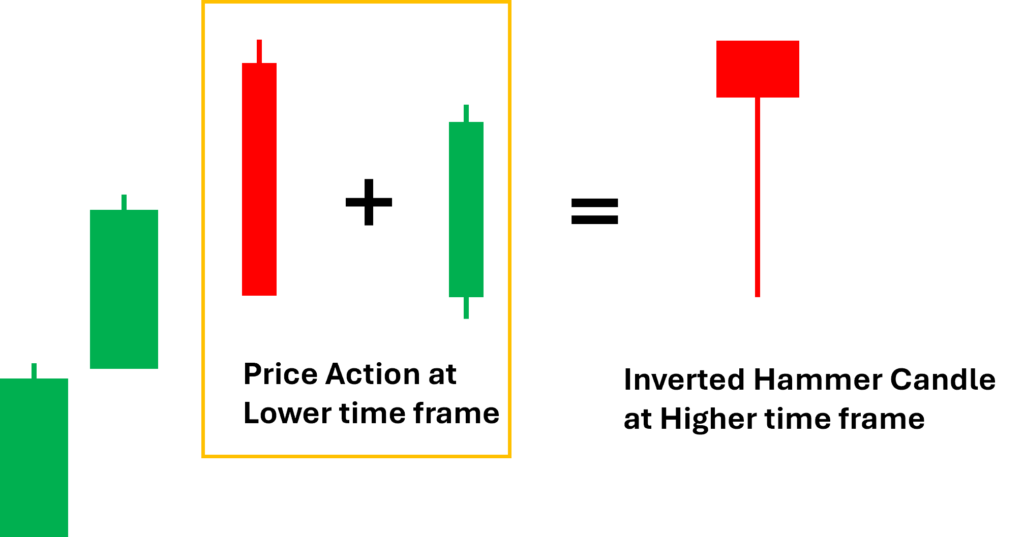
At first glance, you might think: “Okay, buyers stepped in and supported the price—nothing to worry about, right?”
But look closer. This drop during the session signals that sellers are starting to show up. Even though buyers managed to push the price back up, this was the first real test of selling pressure. And when selling pressure starts increasing in an uptrend, it’s a sign that bullish momentum might be running out of steam.
Now, the question is: How do you confirm if this is just a temporary dip or the start of a real reversal?
Hanging man candlestick pattern in technical analysis
Volume: The Key to Hanging Man Reversal Confirmation
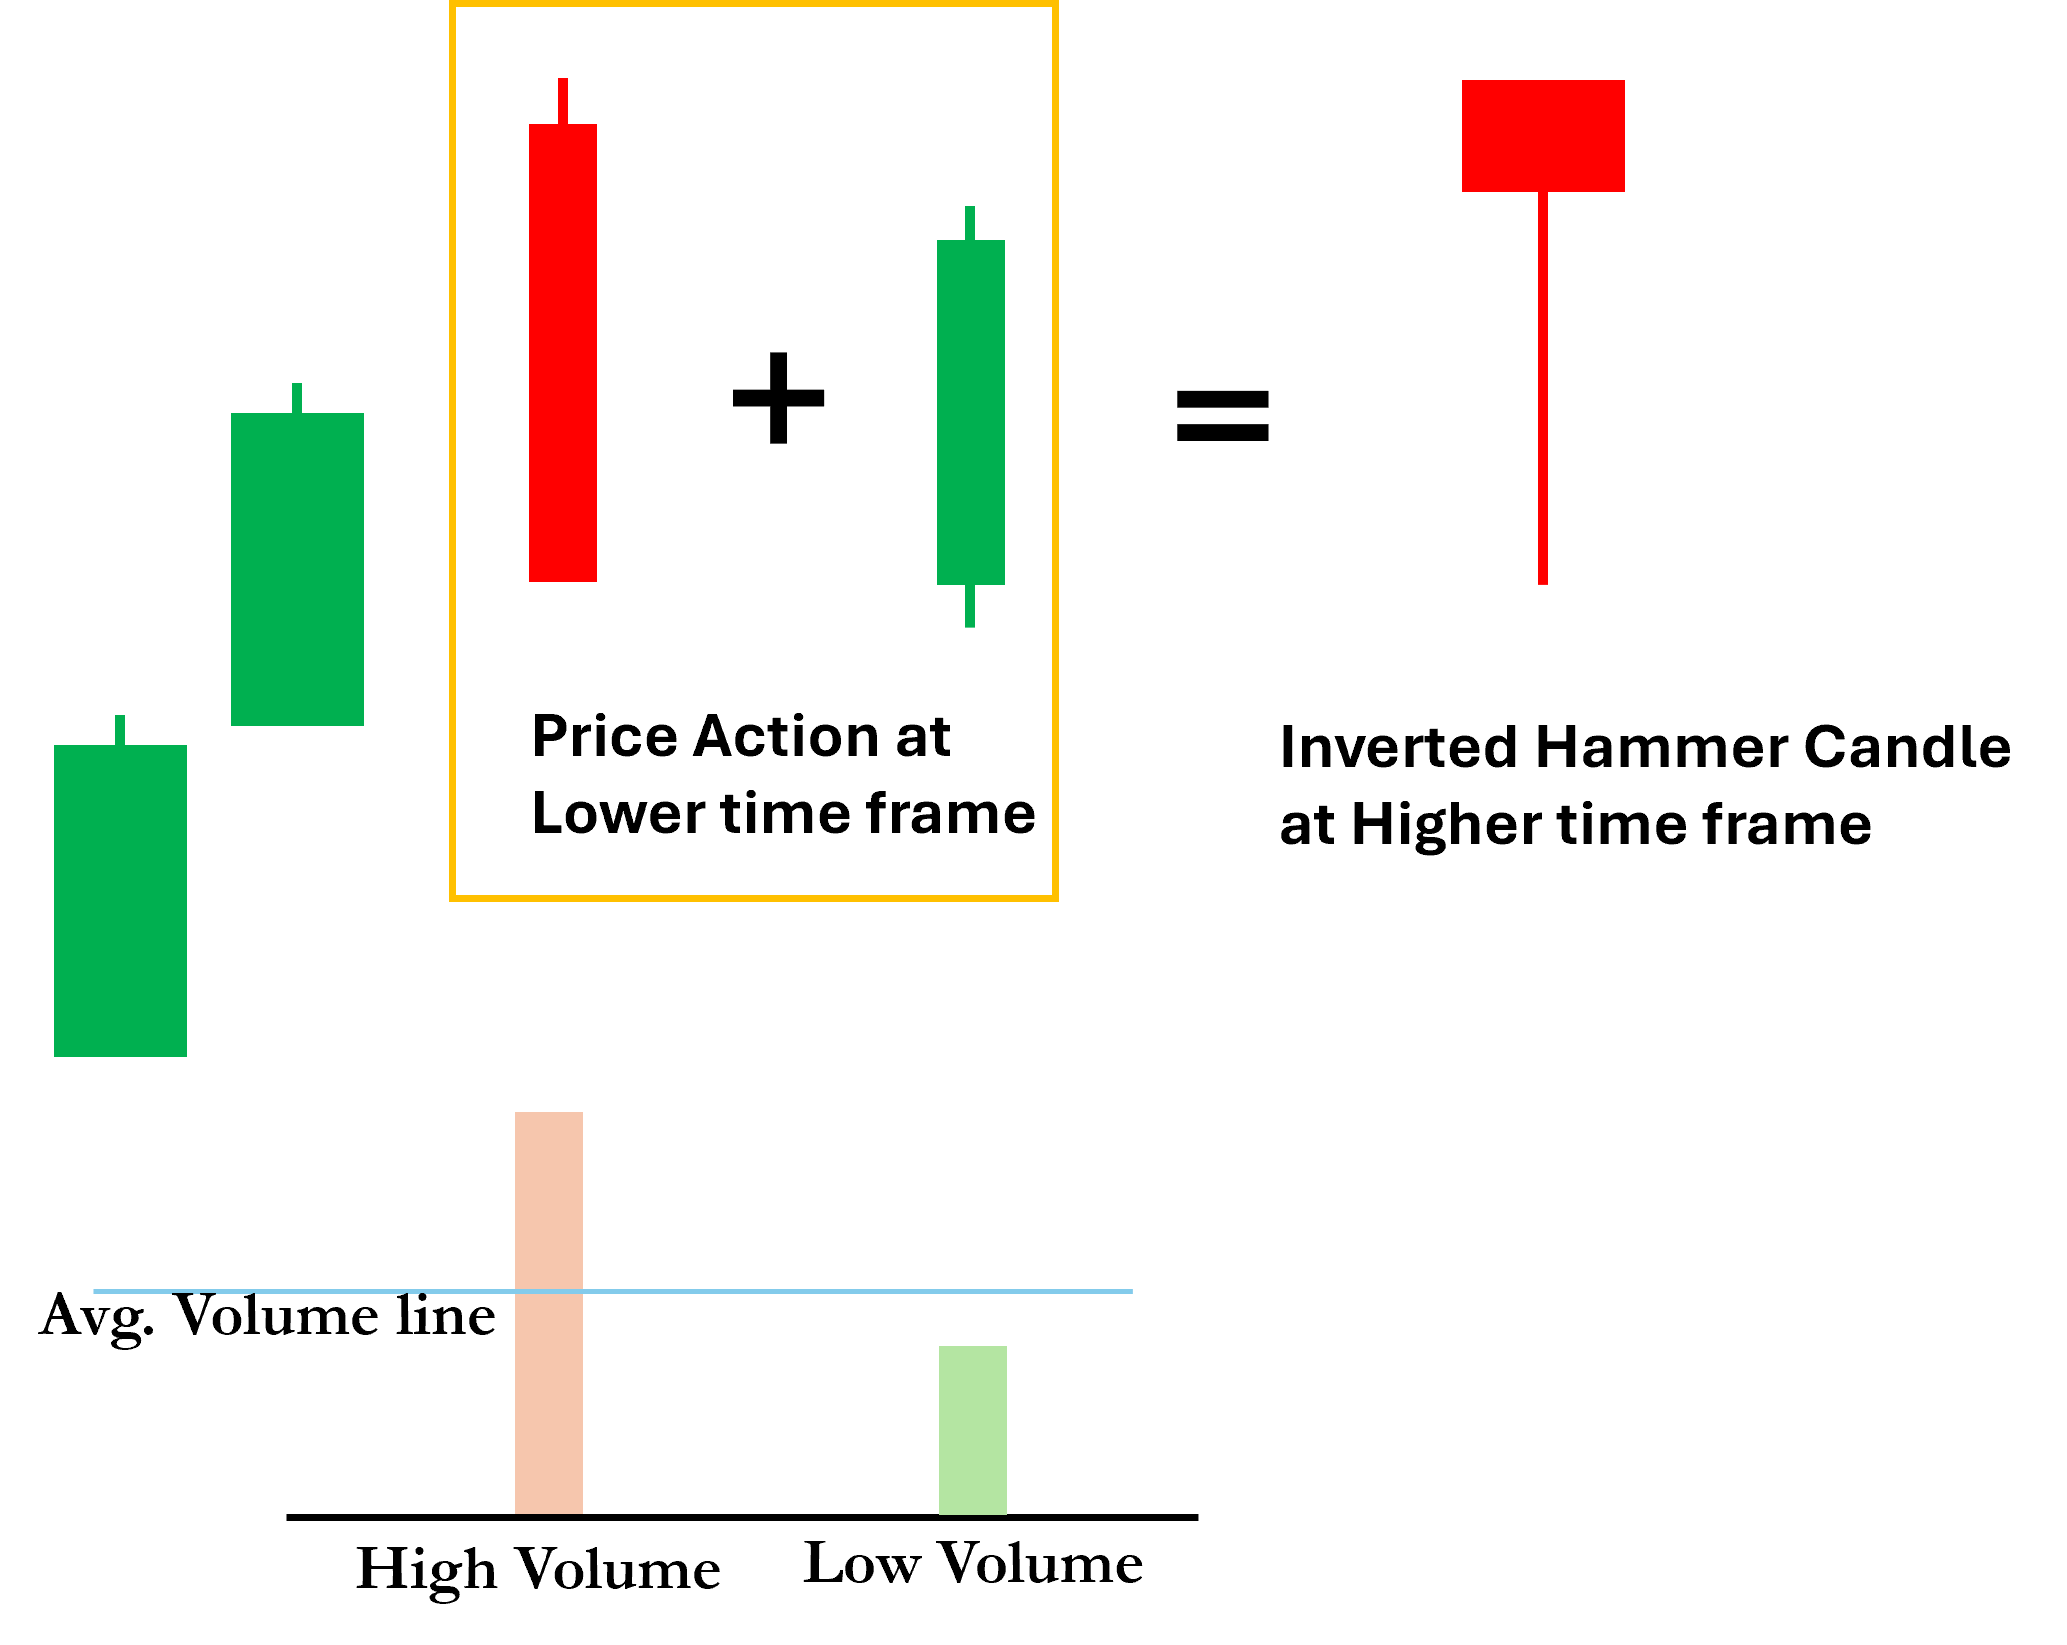
When you observe the price action of a Hanging Man candlestick with Volume Price Analysis: Initially, sellers push the price lower, but buyers regain control and drive the price back up by the close, forming a small real body near the top of the candle. If this occurs after an uptrend, it signals that smart money might be offloading long positions or initiating short positions. A high-volume Hanging Man suggests that buyers attempted to continue the trend but faced strong selling pressure, indicating potential weakness. Even though the uptrend may not reverse immediately, this is the first strong warning sign that bullish momentum could be running out of steam, and a shift in market sentiment might be emerging.
So, if you want to decode the significance of a Hanging Man candlestick, volume is your best ally. A Hanging Man that forms with low volume? Likely just noise—something to note but not necessarily act on. However, if the same candle forms with above average or high volume, then you have something much more significant on your hands.
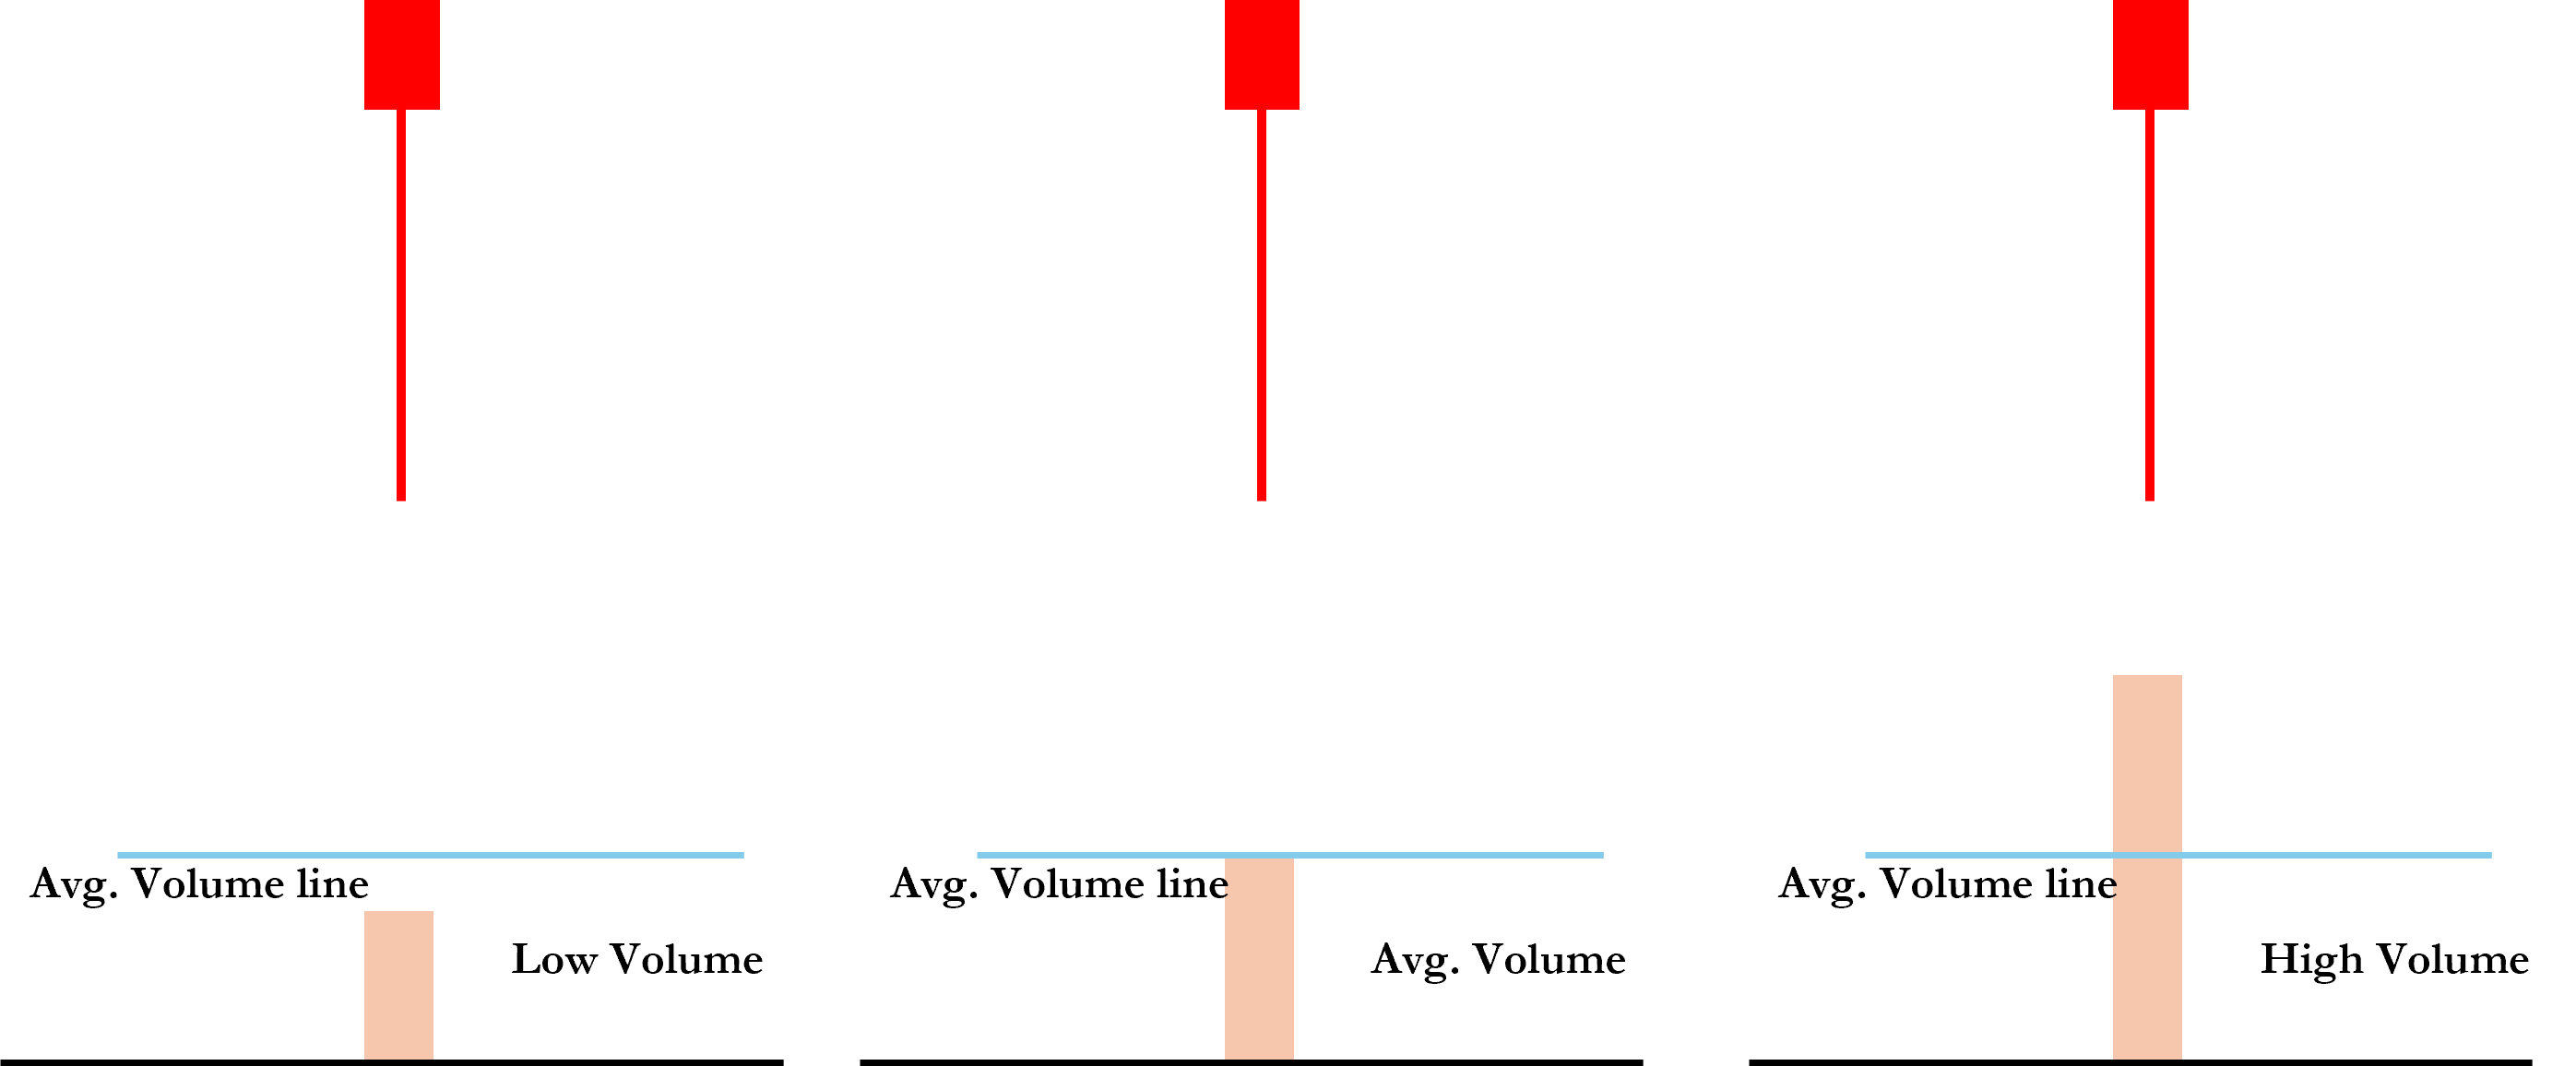
Why does volume matter so much? Because high volume signals the presence of smart money—the institutional players, insiders, and professional traders who shape the market. If they are distributing shares while retail traders continue to buy, this Hanging Man candle could be their first footprint before a major price reversal.
So, what do you do when you see a high-volume Hanging Man? You watch closely. But don’t act just yet—wait for confirmation.
How to confirm a hanging man candlestick reversal?
A Hanging Man is an early warning sign, not an outright reversal signal. It needs validation from subsequent price action. Acting on it alone would be like seeing a dark cloud and assuming a storm is imminent—it’s a clue, not a certainty.
The best confirmation?
- A Shooting Star candle forming within the next few sessions.
- Why is this important? Because a Shooting Star, which has a small body near the low and a long upper wick, indicates that buyers tried to push higher but failed. If this pattern forms shortly after the Hanging Man—and on high volume—it significantly strengthens the bearish outlook.
- Even if a Shooting Star appears a few candles later, it still acts as a confirmation—especially if the price fails to make new highs. This sequence tells us that buyers are losing control and sellers are gaining the upper hand.
Example: Step-by-Step Hanging Man Analysis
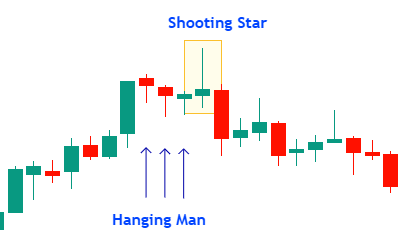
Let’s analyze a real market scenario together. Imagine you’re tracking a stock in an uptrend, and suddenly, this sequence of candles unfolds: 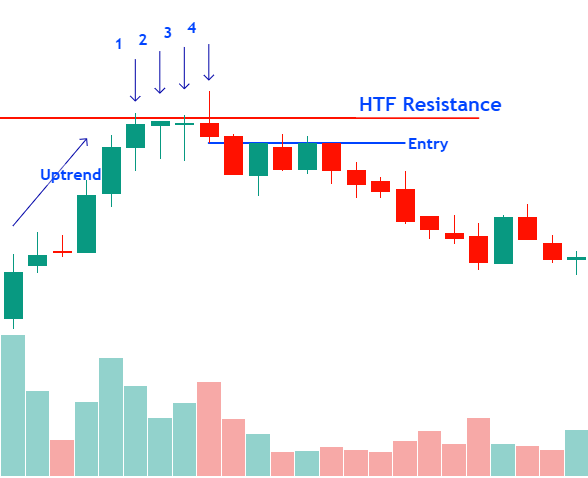
Candle-1: The market is in a strong uptrend, but suddenly, a Hanging Man with high volume appears.
What does this mean? This is the first warning sign that sellers are stepping in. It doesn’t confirm a reversal yet, but it tells you to be cautious.
Candle-2 & 3: Another Hanging Man forms, but this time with slightly average volume.
What’s happening here? The weakness in the uptrend continues—buyers are still trying to push up, but they’re losing control. If you’re holding a long position, it’s time to be cautious. If you’re planning to short, you should be on high alert.
Candle-4: A Shooting Star with high volume appears at a higher timeframe (HTF) resistance.
What does this confirm? Buyers attempted to push higher but failed. This is strong confirmation that the trend is about to reverse. Now, you have a clear bearish setup.
Now, let me ask you—if you saw this exact pattern forming, what would you do?
- If you’re in a long position, would you start reducing exposure?
- If you’re looking for a short entry, would you wait for a break below support?
These are the kind of real-time decisions you need to make based on price action and volume confirmation.
How to trade the hanging man candlestick pattern?
So, how do you trade it? The answer lies in patience and observation.
- Observe, don’t react. A Hanging Man is a warning, not an immediate sell signal. Just because you see one doesn’t mean you should jump into a short position right away.
- Wait for confirmation. Look for a Shooting Star, a bearish engulfing pattern, or another sign of weakness in the next few candles. If you see these signals, the probability of a reversal increases significantly.
- Watch volume closely. If the Hanging Man forms on high volume, it carries far more weight. This suggests that institutional players might be unloading positions, preparing for a downturn.
- Consider additional confluence factors. Is there other technical analysis confirming the weakness? Is the price approaching a major resistance level? The more confirmation you have, the stronger the trade setup.
The Power of Anticipation
When it comes to price action, one candle never tells the whole story. But when you combine the Hanging Man with volume analysis and confirmation signals, you gain a powerful edge—one that allows you to anticipate market weakness before it fully unfolds.
So, the next time you spot a Hanging Man at the top of an uptrend, don’t rush. Instead, take a step back, analyze the bigger picture, and let the market confirm your suspicions. If the signs align, you’ll be in a far better position to capitalize on the shift from bullish to bearish momentum.
Note: This article is part of Tradonomics’ Smart Money Secrets with Volume Price Analysis series. Explore it to unlock powerful trading insights and master Volume Price Action!