
The Largest Business in the World
Every working day, billions of dollars exchange hands in the world’s stock markets, financial futures, and currency markets. Trading these markets is by far the largest business on the planet. And yet, if you were to ask the average businessman or woman why we have bull markets or why we have bear markets, you would receive many different opinions. The truth is that most of these answers miss the real driver behind market moves “Trading Volume Analysis”, which helps us to understand the balance of Supply and Demand that actually shapes trends.
The average person has absolutely no idea what drives the financial markets. Even more surprising is the fact that many traders don’t understand what drives the markets either! A lot of traders are quite happy to blindly follow traditional systems based on technical analysis, indicators, and so on. However, most of them have no real understanding of the underlying cause behind market moves. These are intelligent people. Many have been trading the financial markets in one way or another for years, and a large number of them have invested substantial amounts of capital in the stock market.
So, despite financial trading being the largest business in the world, it is also the least understood. Sudden moves remain a mystery, often arriving when least expected and appearing to have little logic. Frequently, the market does the exact opposite of a trader’s intuition. Even those who make their living from trading particularly brokers and pundits, who you would expect to have a detailed knowledge of market causes and effects very often know little about how the markets really work.
It is said that up to 90% of traders are on the losing side of the stock market. Perhaps many of these traders already have the perfect system to become successful—all they need to do is trade in the opposite direction of their gut feeling!
More sensibly, Tradonomics will help you trade intuitively but in a professional way through concepts like Trading Volume Analysis.
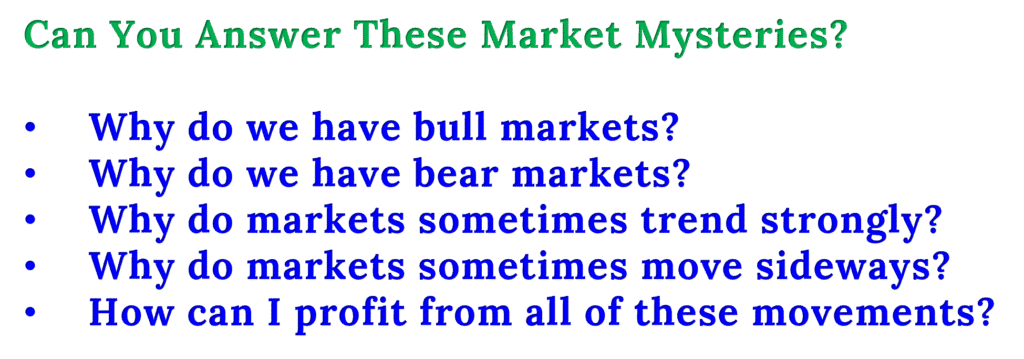
Below is a brief series of questions. As an experiment, see if you can answer any of them:
-
- Why do we have bull markets?
- Why do we have bear markets?
- Why do markets sometimes trend strongly?
- Why do markets sometimes move sideways?
- How can I profit from all of these movements?
If you can answer these questions with confidence, you do not need to read this Trading Volume Analysis Series by Tradonomics. If, on the other hand, you cannot, do not worry, because you are not alone. You will have the answers by the time you reach the end of this series.
The Market Professionals
In any business where there is money involved and profits to make, there are professionals. We see professional diamond merchants, professional antique and fine art dealers, professional car dealers and professional wine merchants, among many others. All these people have one thing in mind; they need to make a profit, a lot of profit from a price difference to stay in business.
The financial markets are no different and professional traders are also very active in the stock, F&O, currency and commodity markets these people are no less professional than their counterparts in other areas.
So, what do I mean by a professional trader?
Smart Money
In the trading world, market participants are often divided into two groups: the crowd, which typically loses money and the so-called Smart Money, which seems to move the markets. Smart Money generally refers to large institutional traders whose trading volumes are significant enough to shift the balance of supply and demand.
The market is a mix of small and large players. The big players like banks, hedge funds, corporations, and other institutions are the Smart Money. Because they operate with such huge volumes, they have the power to influence the direction of a trend. By comparison, retail traders or small participants are like passengers on a train that Smart Money is driving.
For our analysis, we focus only on Smart Money, because they are the true force behind price movement.
- The key idea is to study what Smart Money is doing and simply follow in their footsteps through Trading Volume Analysis.
- The first step is recognizing their influence: Smart Money moves the price. Whether you call it “market manipulation” or simply market impact, the result is the same, they are behind every significant trend.
- Smart Money can be viewed as an assumption: an almost mythical trader who never loses and always has access to unlimited capital to push price in either direction.
- Since Smart Money trades in massive volume, tracking them requires close attention to volume spikes. Sudden surges in activity are often footprints of Smart Money at work.
- Importantly, Smart Money is not one person or a single fund manager. It is a broad term that includes institutional investors, hedge funds, banks, and even corporations investing excess cash. Labels do not matter what matters is that they have the financial power to tip supply and demand in their favour.
Sometimes these big players act together, pushing in the same direction, but at other times they compete directly against each other. That is why we always see both bullish and bearish institutional traders.
Remember: while all Smart Money are institutional players, not all institutional players qualify as Smart Money. The group that successfully drives price in its favour becomes Smart Money; those who fail become the so-called “Dumb Money.” As traders, our task is to identify the winning side and align ourselves with it. Price movement is the direct result of supply and demand forces.
To simplify:
- Bullish pressure means there are buyers, Smart Money in a buying phase and creating demand.
- Bearish pressure means there are sellers, Smart Money offloading positions and creating supply.
So, whenever we refer to bullish and bearish pressure, we are really talking about supply and demand. In practice, it’s simple: when demand outweighs supply, prices rise; when supply outweighs demand, prices fall. Strong demand with weak supply pushes the market upward, while heavy supply with weak demand forces it downward.
In short, all price action boils down to this constant battle between bullish and bearish pressure, with Smart Money acting as the decisive force behind the scenes. Trading Volume Analysis helps us track this battle effectively.
Technical Analysis by Richard D. Wyckoff
Have you ever heard of Richard D. Wyckoff? He is the mastermind who developed a systematic method for analyzing the stock market, known today as the Wyckoff Method. Although it was created in the early 20th century, this approach remains one of the most practical and powerful ways to understand how financial markets really work. Wyckoff focused on the behaviour of smart money and how their actions shape overall price movements.
So, how does the stock market function according to Wyckoff?
The stock market functions as a structured interaction between smart money and retail traders. According to Wyckoff, price movements are driven by the fundamental forces of supply and demand, which create predictable patterns over time. These dynamics unfold through a repeating cycle of four key phases:
- Accumulation
- Markup
- Distribution
- Markdown
But here is the catch, the smart money does not play fair. They deliberately use manipulation tactics to mislead retail traders and hide their true intentions. These include false breakouts and breakdowns designed to create panic selling (Selling Climax) or premature buying (Buying Climax) . This way, smart money can accumulate or distribute shares at the most favourable prices, all while trapping the public in bad positions.
So, how do we reveal these smart money moves?
Wyckoff introduced the Three Laws (often called Wyckoff Law) to simplify Price Action Analysis and expose Smart Money Strategies. He focused on analyzing the relationship between price and volume patterns in a structured way to create a predictable and actionable method. This approach is commonly known as Trading Volume Analysis.
Why Is Volume So Important for Wyckoff?
For Wyckoff, volume is one of the most powerful tools in understanding market behaviour because it represents the actual effort behind price movements and true footprint of market participants. It reveals where the money is flowing, who is stepping in, and when momentum is shifting. In fact, volume often precedes the price. That’s why Wyckoff placed so much emphasis on analyzing the relationship between price and volume patterns.
Day traders, in particular, rely on Volume Price Analysis because it helps them spot critical market actions, such as:
- Accumulation before a breakout
- Distribution before a crash
- Confirmation of trends and reversals (Sign of Strength or Sign of Weakness)
- Avoiding false breakouts and traps
Smart money can’t hide their movements. Whenever they want to accumulate or distribute shares, it shows up in volume spikes, unusual activity, and price action anomalies. For example, high volume combined with little price movement may indicate absorption during accumulation, while high volume during a failed breakout may signal distribution.
Wyckoff’s Three Laws explain that every meaningful price movement must be supported by volume. Without Trading Volume Analysis, traders risk being deceived by manipulative tactics. Instead of merely reacting to price, understanding volume allows traders to anticipate smart money’s strategy, giving them a real edge in the market.
Why Is Trading Volume Analysis Important in Trading
In the old times, The Stock Exchanges trading floor was once a hub of energy, filled with brokers clad in colourful jackets, shouting orders and using intricate hand signals to complete trades. The structured chaos allowed traders to rely on human intuition, reading market sentiment and making quick decisions. This open outcry system provided an edge, traders could assess market momentum by observing the urgency and emotions of their peers, making volume a critical factor in trading success.
These traders thrived in a highly physical environment where they could feel the market’s pulse in real time. They sensed shifts in sentiment through the collective behaviour of the crowd. The noise, the urgency, the hesitation, these subtle cues revealed the true state of the market.
Then came electronic trading, and with it, a fundamental change.
Many pit traders struggled to transition to screen-based trading. Why? Because they lost their ability to read volume intuitively. The days of judging market sentiment through physical interaction were gone. No longer could they interpret hesitation, panic, or confidence by watching the crowd.
What they had in the pit was real-time order flow, which we now analyze through volume charts. When the trading floor disappeared, so did the ability to validate price action through direct observation. This is why understanding volume’s role in modern markets is essential for trading success.
Understanding Trading Volume Analysis
Volume plays a crucial role in market analysis. One of its most valuable characteristics is that it reveals when Smart Money are entering the market. By carefully studying volume, we can identify moments when these big traders are shifting the balance of supply and demand, which often leads to a change in trend direction.
Ignoring Trading Volume Analysis is a costly mistake. More importantly, you cannot overlook sudden spikes in activity. Abnormal or unusually high trading volume is rarely random, and it reflects the presence of Smart Money operating with massive orders.
The real question you should ask yourself is: why did these players suddenly become so active? What do they know that I don’t?
Keep the following in mind:
- Smart Money are high-capacity investors. They trade in such large volumes that they can directly push prices in one direction or even reverse a trend entirely by altering the supply-demand balance.
- Rising volume and sudden surges are footprints of their activity.
- Volume always represents a two-sided trade. If volume shows 100, it means 100 shares were both bought and sold. The Bulls bought and the Bears provided the supply. For every buy order there has to be a sell order.
- Trading Volume Analysis alone doesn’t explain anything. It has to be studied in context compared with price movement, the prior trend, and surrounding conditions. Only then can you make sense of what Smart Money is really doing.
- Sudden surges in volume often tilt the balance of supply and demand, setting up conditions where the existing trend becomes vulnerable and may reverse.
In essence, Trading Volume is the footprint of Smart Money. By learning How to Read Price Action and How to Read Chart through the lens of Trading Volume Analysis, traders gain a powerful tool to anticipate shifts in trend before the wider market reacts.
Trading Volume Analysis Example
Example #1: Volume Surge in an Uptrend
Imagine the market is in a bullish trend. To keep things simple, let’s assume that each trader can only buy or sell one share.
In an uptrend, the number of buyers (Bulls) outweighs the number of sellers (Bears). This imbalance creates stronger buying pressure, which pushes prices higher.
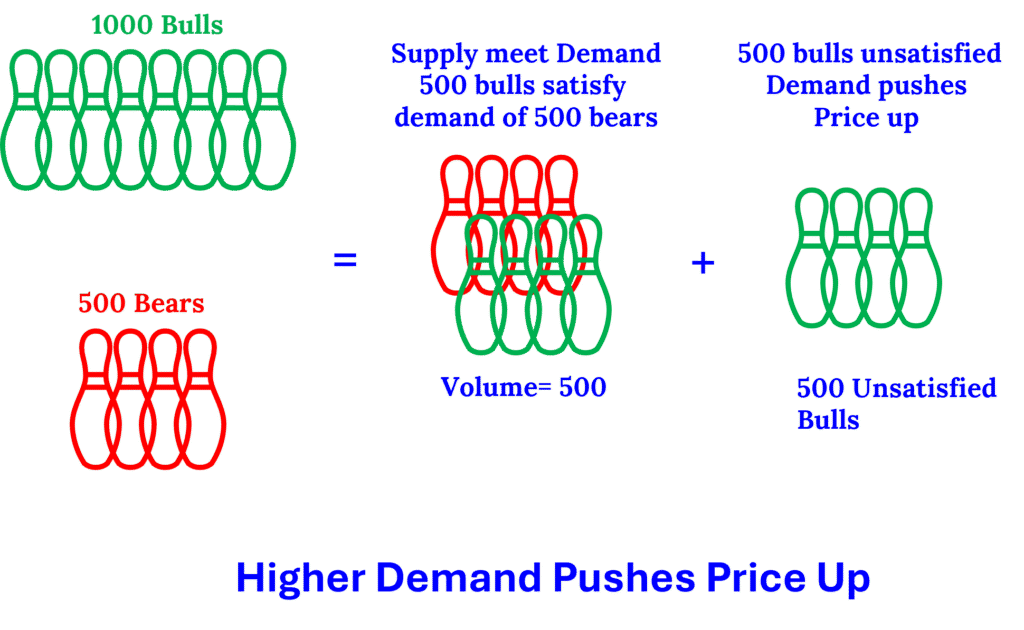
Figure #1: Mechanics of a Bullish Trend
Suppose there are 1,000 Bulls but only 500 Bears. Because sellers are fewer in number, supply is limited. Out of those 1,000 Bulls, only 500 can buy shares—since only 500 are available to be sold. The remaining 500 Bulls are left unsatisfied, competing for shares and driving the price higher.
In this case, only 500 shares actually change hands (1 share per trader), so the trading volume equals to 500 shares.
Of course, in the real market, we can’t see the exact number of unfilled buyers. What we do know is that stronger bullish pressure and limited supply lead to price increases. This dynamic explains the natural behaviour of a bullish trend and shows why Trading Volume Analysis is essential for identifying the hidden forces of demand and supply.
Now, consider what happens when we suddenly see a volume spike during this uptrend. Such a surge signals that a wave of new sellers has entered the market. These are not ordinary traders. They are Smart Money stepping in with significant selling power. At that moment, Smart Money is taking a bearish stance.
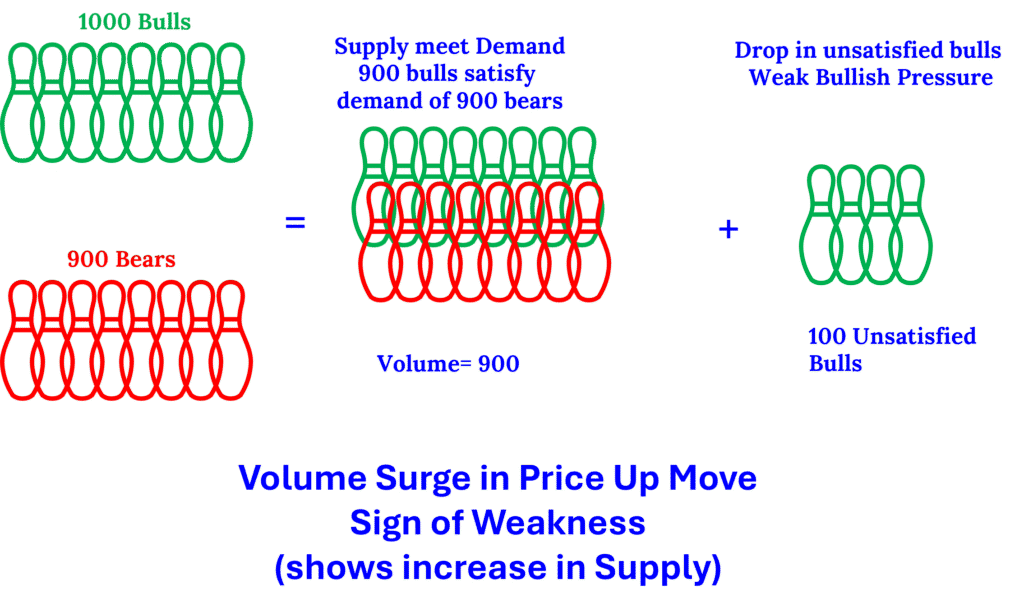
Figure #2: Smart Money Entering in a Bullish Trend
This shift in volume indicates more than just higher activity. It shows that large traders are moving against the trend and their participation can alter the balance of supply and demand and setting the stage for a potential change in trend direction.
Comparing Figure #1 and Figure #2
When we compare Figure #1 with Figure #2, the main difference lies in the number of Bears. As the number of Bears increases from 500 to 900, trading volume rises from 500 to 900. In real market conditions, we still don’t know how many Bulls remain unsatisfied, but the key insight is this: whenever we see a sudden surge in volume during an uptrend, several things become clear:
- Smart Money has stepped in.
- Their current stance is bearish.
- A fresh wave of Bears is entering the market.
- Supply is increasing.
- The larger the volume surge, the stronger the wave of bearish pressure (increase in supply).
- As bearish pressure strengthens, bullish pressure weakens. Many Bulls who wanted to buy have already entered, and there may not be enough new buyers to absorb the extra supply.
- If the surge in bearish pressure is strong enough, Smart Money can tip the balance in favour of the Bears and potentially reverse the trend downward.
This is exactly where Trading Volume Analysis becomes powerful and it helps traders spot whether a spike in activity is just noise or the footprint of Smart Money.
However, there are still unknowns:
- We cannot measure exactly how many Bulls remain unsatisfied. The only way to confirm is to monitor subsequent price action and see if this wave of Smart Money Bears successfully overwhelms bullish demand.
- Markets also contain two types of Bulls: impatient retail traders (the crowd), who push prices higher without waiting, and Smart Money Bulls, who prefer to wait for prices to fall before stepping in. Smart Money Bears can easily overpower the impatient crowd, but when the price declines, a new wave of Smart Money Bulls may re-enter and restore the uptrend.
This is why we must carefully track both price and volume behaviour with Trading Volume Analysis to determine whether the surge marks a true reversal or simply pauses the bullish trend and leads to a sideways consolidation.
Example #2: Volume Surge in a Downtrend
This case is the mirror opposite of the uptrend example. Again, for simplicity, let’s assume each trader can only buy or sell one share.
In a downtrend, the market has more sellers than buyers. Bearish pressure dominates, meaning supply is high while demand is limited.
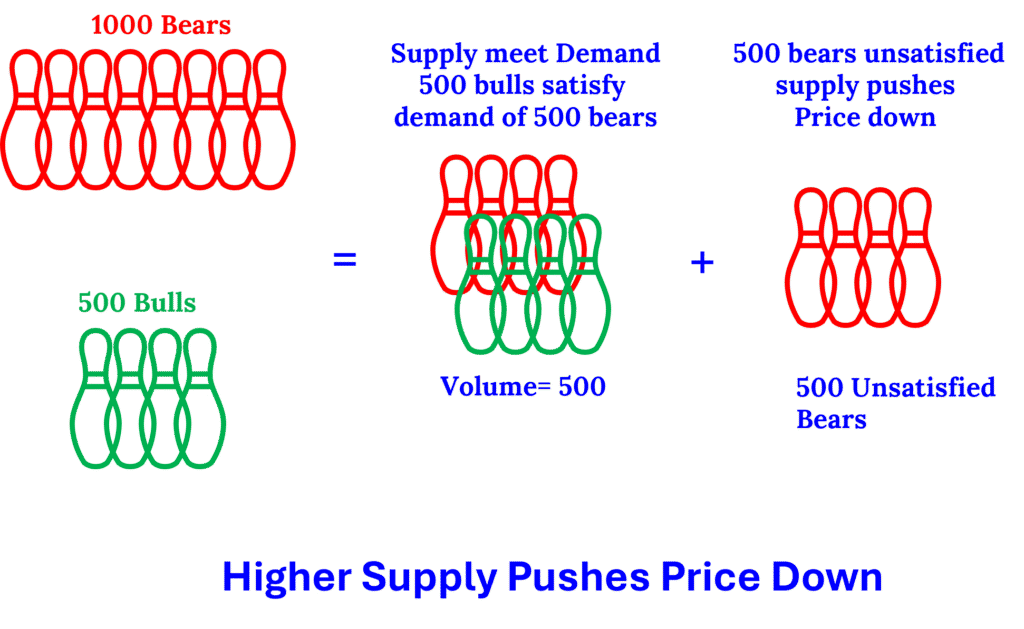
Figure #3: Mechanics of a Bearish Trend
Suppose there are 1,000 Bears and only 500 Bulls. Because sellers far outnumber buyers, supply exceeds demand. Out of those 1,000 Bears, only 500 can sell, as there are just 500 Bulls willing to buy. The remaining 500 Bears are left unsatisfied, forcing prices lower to attract buyers.
In this situation, 500 shares exchange hands, so the trading volume equals 500 shares.
Just like in the bullish case, we can’t know exactly how many sellers remain unfilled. All we know is that strong bearish pressure and insufficient demand push prices downward. This is the natural behavior of a bearish trend.
Now imagine that, during this steady decline, trading volume suddenly surges. Such an increase signals that a large wave of Bulls is entering the market. These are not random buyers. They are Smart Money and stepping in to accumulate at lower prices. In this phase, Smart Money is bullish.
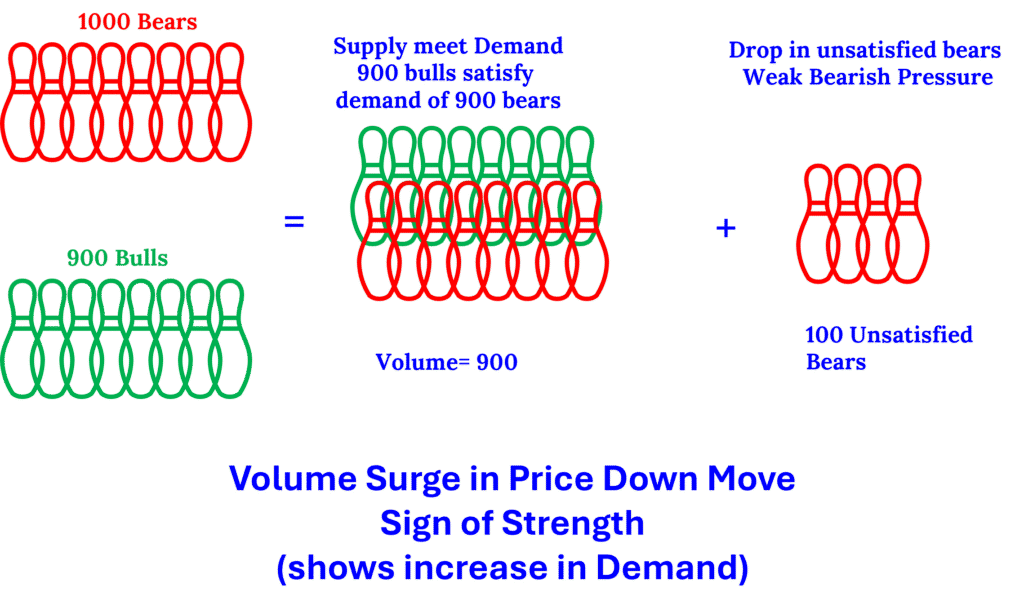
Figure #4: Volume Surge during Down-Trend
In Figure #4, you can see how the sudden increase in the number of Bulls changes the dynamics of the downtrend. Unlike Figure #3, where only 500 Bulls were willing to buy, now we have 900 Bulls stepping in. This surge in buying interest increases the traded volume from 500 shares to 900 shares.
The key difference between Figure #3 and Figure #4 is the strength of demand. With more Bulls entering the market, the balance between Supply and Demand begins to shift. This influx of buying pressure doesn’t just increase volume—it actively weakens the selling pressure from Bears. If this volume surge is strong enough, it can tilt the balance in favour of the Bulls and potentially mark the end of the downtrend, leading to a reversal.
When we compare Figure #3 with Figure #4, the key difference is the number of Bulls. As their number grows from 500 to 900, the trading volume rises from 500 to 900. This tells us several things:
- Smart Money has entered the market.
- Their stance is now bullish.
- A new wave of buyers is stepping in.
- Demand is increasing.
- The stronger the volume surge, the greater the bullish pressure.
- Rising demand begins to weaken bearish pressure.
- If the surge in demand is strong enough, Smart Money may flip the supply-demand balance in favour of the Bulls and trigger a reversal to the upside.
Here again, Trading Volume Analysis gives traders the ability to read between the lines of market activity.
What we still don’t know is equally important:
- We can’t be sure how many Bears remain unsatisfied. To confirm, we must watch future price action and see whether Smart Money Bulls can overpower the selling pressure.
- Bears behave differently than Bulls. They tend to be more aggressive, impatient, and shorter-term in nature. This explains why downtrends are often sharp and volatile, while uptrends usually stretch out over longer periods. Prices may chop sideways at resistance, while support levels in a decline are often fast and abrupt. However, patient Smart Bears may still wait for a bounce to sell again.
That’s why it is critical to keep tracking both price and volume through Trading Volume Analysis to determine whether the bounce is the start of a true reversal or just a temporary rally within a broader bearish trend.
The Game Never Changes
For decades, markets have repeated the same cycle of emotions—greed, fear, panic, and euphoria. Smart Money understands these cycles and uses them to their advantage: driving prices higher when retail traders fear missing out and pushing them lower when the public panic sells.
The only way to keep up is simple:
- Watch the volume.
- Follow the smart money footprints through Trading Volume Analysis.
- Remember this rule: price can deceive, but volume never lies.
Note: This article is part of Tradonomics Smart Money Secrets with Volume Price Analysis series. Explore it to unlock powerful trading insights and master Volume Price Action!