
When you first look at a candlestick or an entire chart, a flood of questions may cross your mind:
-
- How do I read candlesticks correctly?
- How can I confirm if a candlestick pattern is valid?
- What is the right way to analyze price action through candlestick patterns?
- Do I really need to memorize all the candlestick patterns out there?
![]() The truth is, you do not need to memorize dozens of patterns to become a skilled trader. What matters most is understanding how to read the price action within each candlestick. Every candle tells a story about the battle between buyers and sellers and once you learn to interpret that story, patterns start to make sense naturally.
The truth is, you do not need to memorize dozens of patterns to become a skilled trader. What matters most is understanding how to read the price action within each candlestick. Every candle tells a story about the battle between buyers and sellers and once you learn to interpret that story, patterns start to make sense naturally.
In this article, we will break down how to read candlestick price action correctly step by step, so you can move beyond memorization and truly understand what the market is trying to tell you.
What is Candlestick Price Action?
Candlestick price action is the art of reading what each candle is telling you about the ongoing battle between buyers and sellers. Every candlestick represents a period of trading whether that is 1 minute, 1 hour, or 1 day and shows you where price opened, how high and low it went, and where it finally closed. This simple structure contains powerful clues about market sentiment and momentum.
Many traders make the mistake of focusing only on memorizing candlestick patterns. Patterns like the Hammer, Doji, or Bearish Engulfing do provide insights, but they are only snapshots. On their own, they do not always tell the full story.
That is where reading candlestick price action becomes important. Instead of treating each pattern like a magic signal, candlestick analysis looks deeper. It asks:
-
- Who is in control—buyers or sellers?
- Is the move strong or weak?
- What does this candle mean in the context of the trend or nearby support and resistance levels?
When you shift your mindset from memorizing dozens of candlestick formations to truly understanding the price action in candlesticks, you will start to see the bigger picture. You will know why a Hammer forms, why an Bullish Engulfing candle matters in one situation but not in another and how to use these signals effectively in your trading.
In short patterns can be helpful, but reading candlestick price action correctly is far more powerful for trading success.
Anatomy of a Candlestick: The Basics
Before you can master candlestick price action, you need to understand the building blocks of a candlestick chart. Every candle is made up of four key data points, often called OHLC:
-
- Open – the price where the candle started.
- High – the highest price reached during that period.
- Low – the lowest price during that period.
- Close – the price where the candle ended.
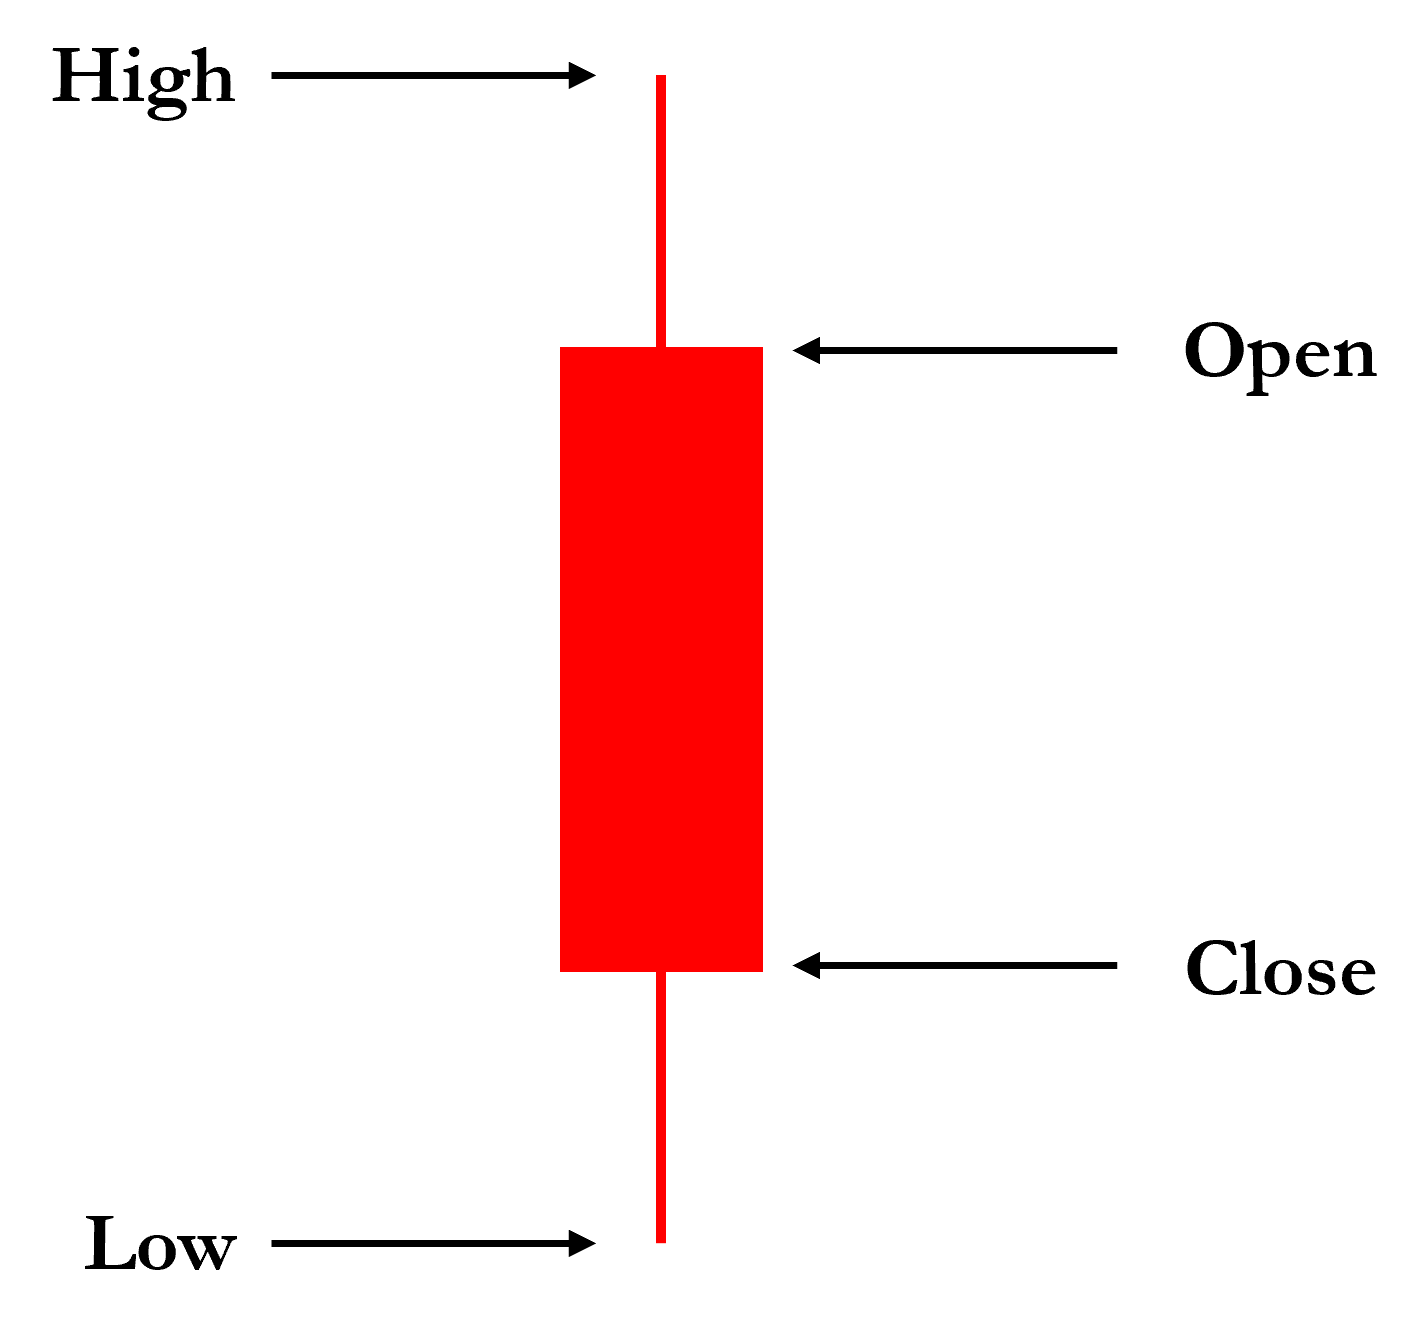
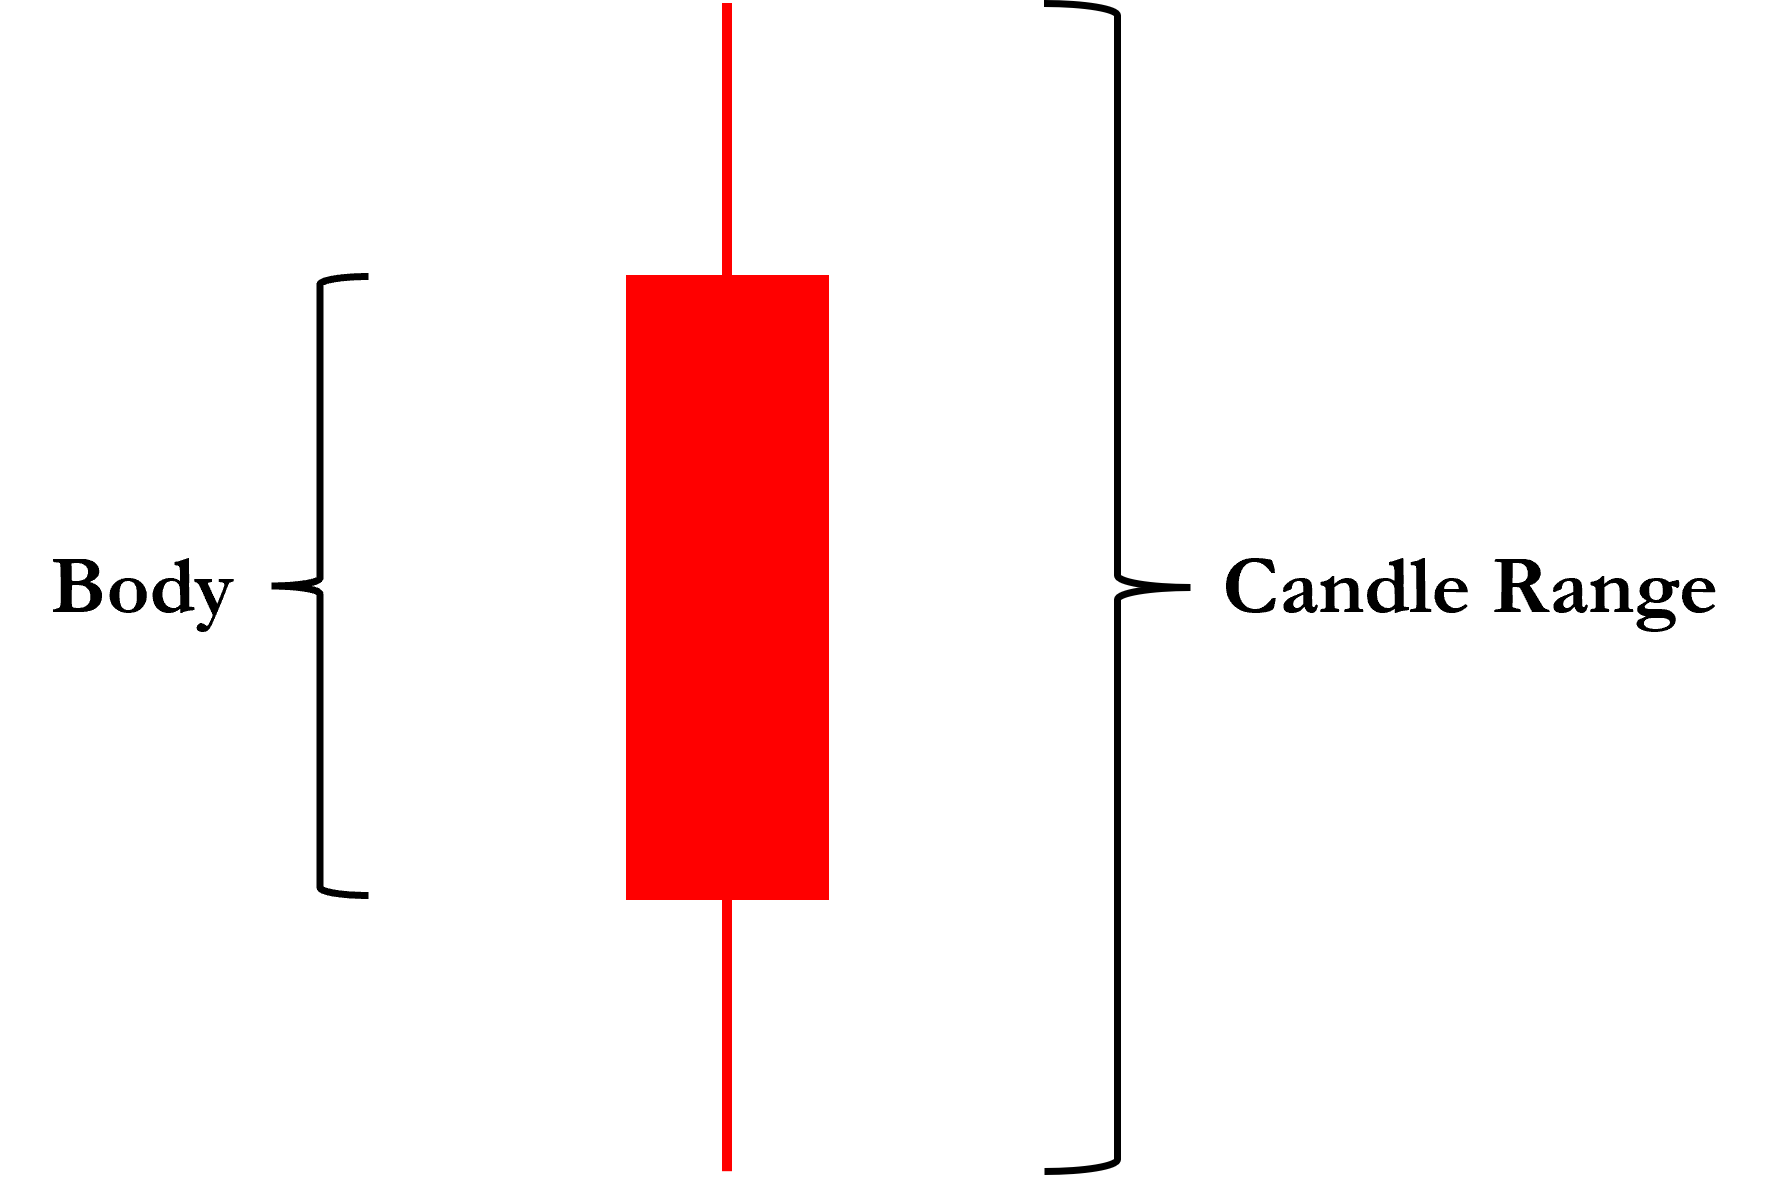
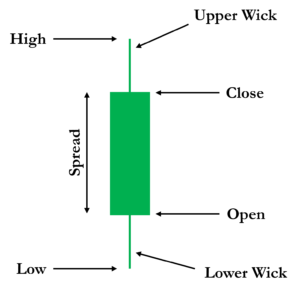
These four values form the foundation of candlestick chart basics, and they are displayed through two main parts of the candle: the body and the shadows (or wicks).
The Candlestick Body
The body is the thick part of the candlestick. It shows the distance between the open and close.
There are two main types of candlesticks based on color of candlestick body:
- Bullish Candlestick (Green) – Forms when the close price is higher than the open price, indicating buying pressure.
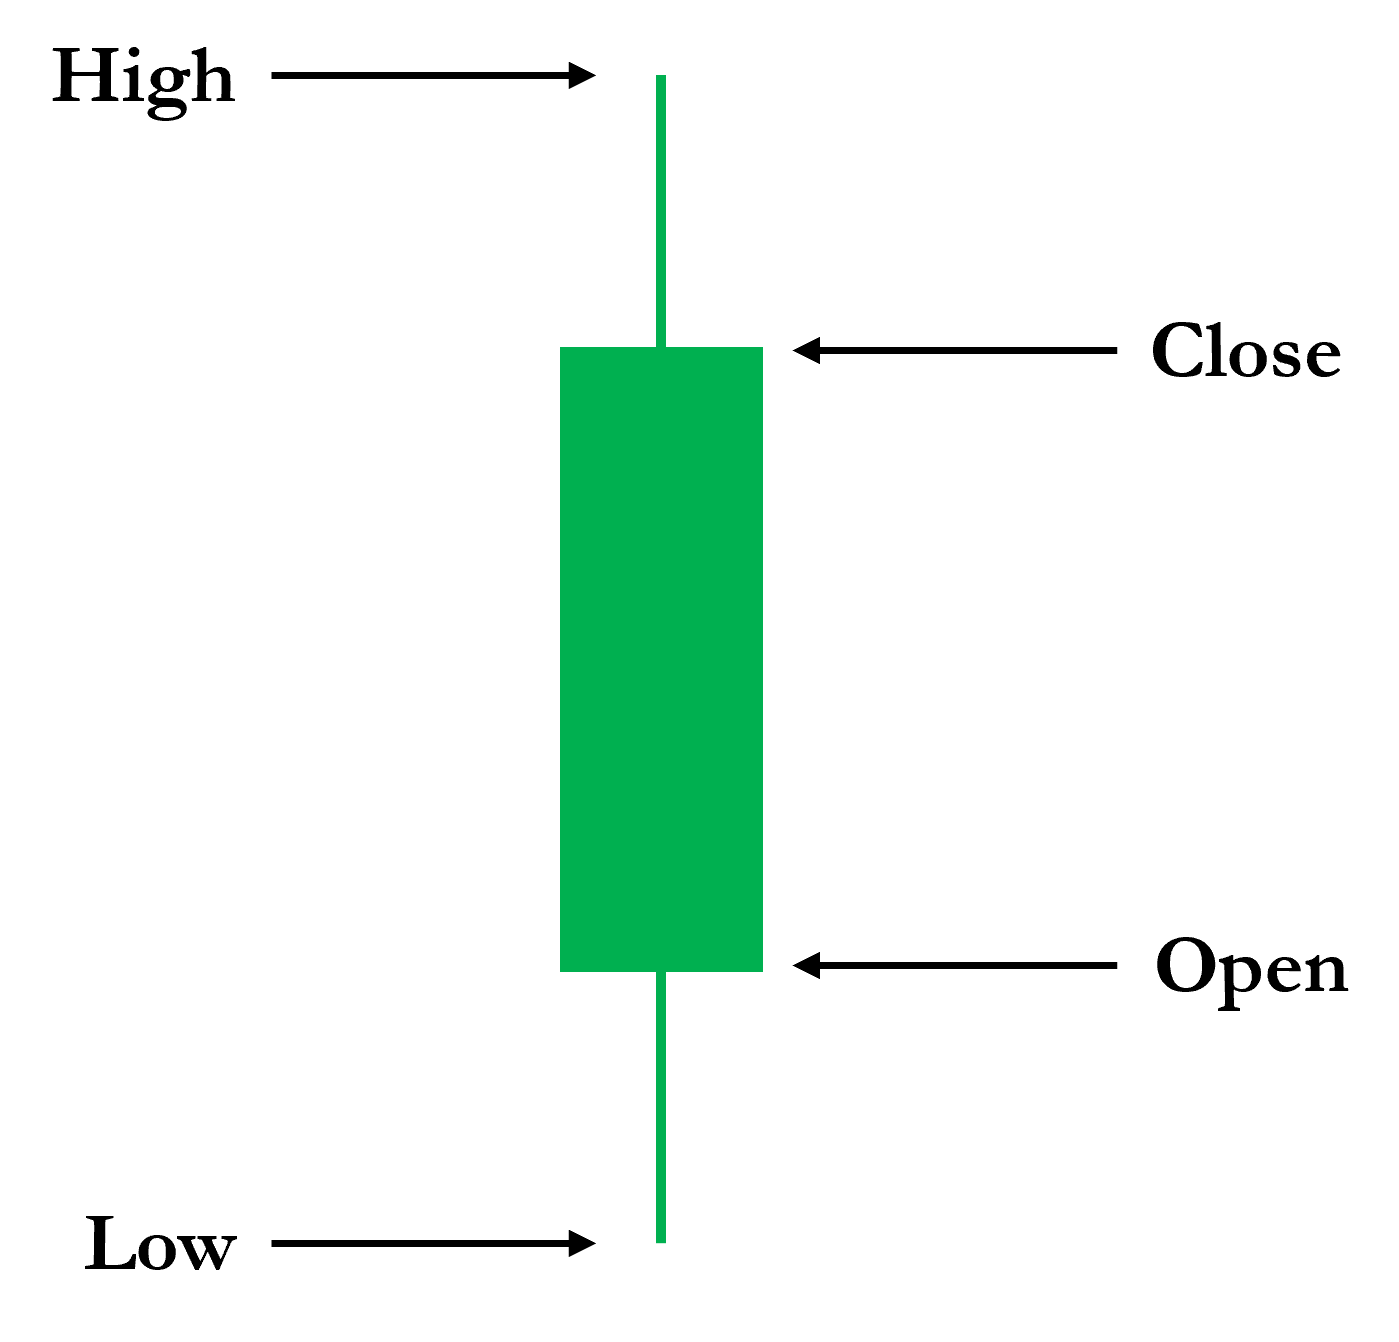
- Bearish Candlestick (Red) – Forms when the close price is lower than the open price, indicating selling pressure.
- The larger the body, the stronger the buying or selling pressure.
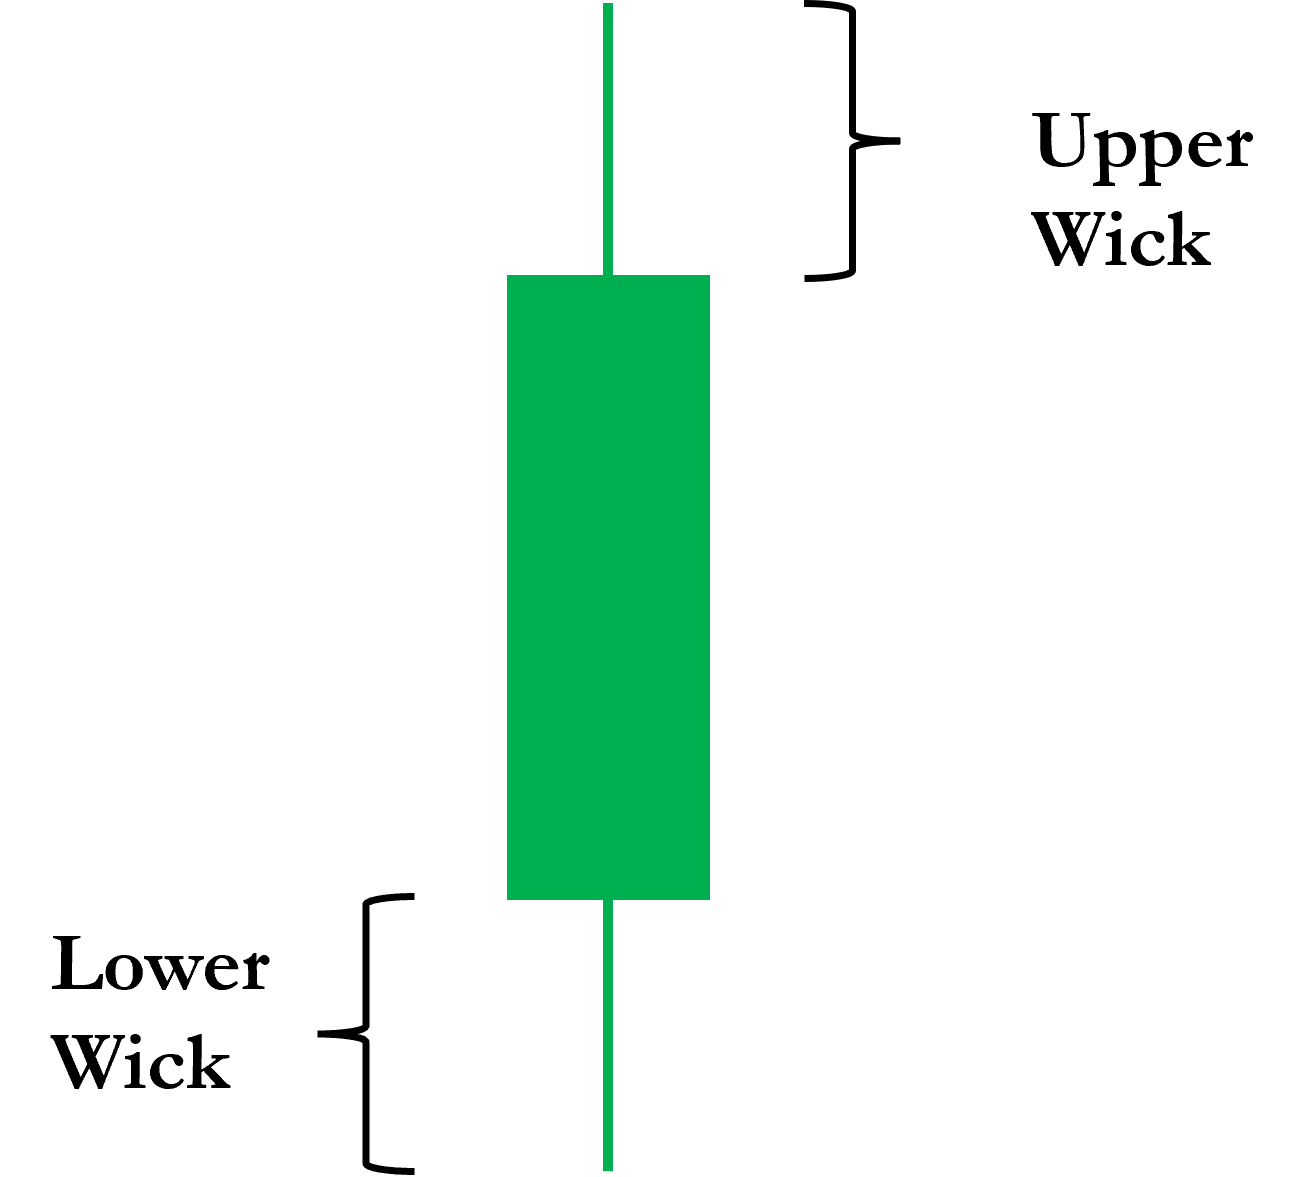
The Shadows or Wicks
The thin lines above and below the body are called wicks or shadows. They reveal how far price moved beyond the open and close.
-
A long upper wick shows that buyers pushed the price higher, but sellers forced it back down, signaling possible rejection of higher prices.
-
A long lower wick suggests sellers drove the price down, but buyers stepped in to push it back up, showing demand at lower levels.
So when you look at any candlestick, and you will see seven key elements:
-
- Open price
- High price
- Low price
- Close price
- Upper wick
- Lower wick
- The spread (Body) & range of the candle
Now, while all of these play a role in defining price action, the wicks and the spread are where the most revealing clues lie.
When you able to read the candlestick body and candlestick wick together, you gain a deeper understanding of market psychology; who is winning, who is losing, and where price might head next.
How to Read Candlestick Price Action Step by Step
Candlestick Price Action as a Battle
Every candlestick is more than just a shape on a chart. It is the record of a battle between buyers and sellers for a time period. Think of it like a tug-of-war: sometimes buyers pull harder, pushing prices higher. Other times, sellers regain strength and drag prices lower. This struggle plays out within every single candle, no matter the timeframe is the essence of candlestick price action.
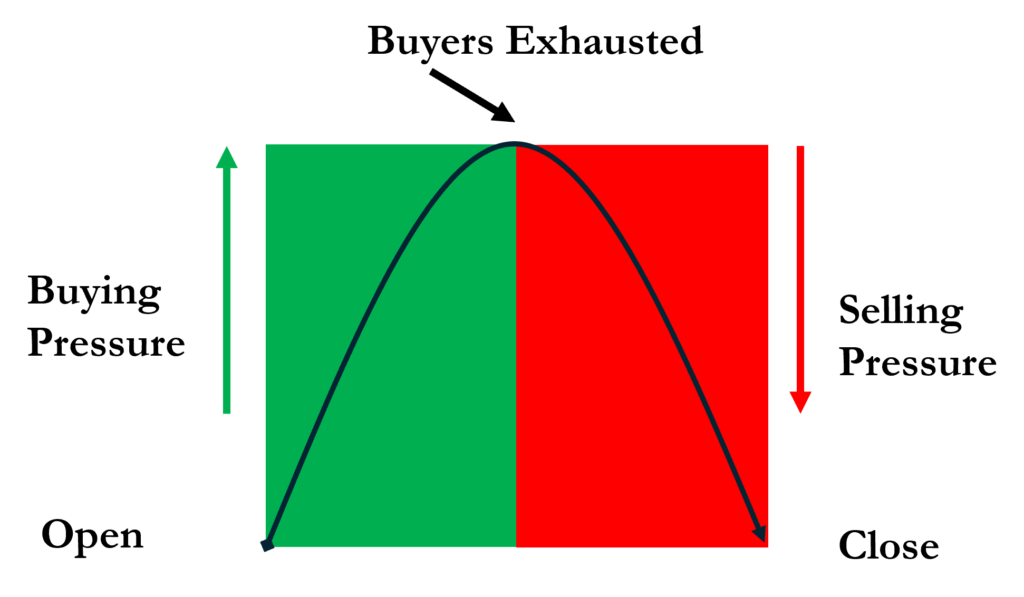
You can also imagine price movement like a sine wave, continuously rising and falling. A candlestick captures the outcome of that wave during a given timeframe. It shows you the open, high, low, and close but not the exact path how price took to get there.
And that is the fascinating part: two very different price journeys can form the same candlestick. One candle might represent a steady climb and sharp rejection at the end, while another could reflect wild swings before settling at the same close.
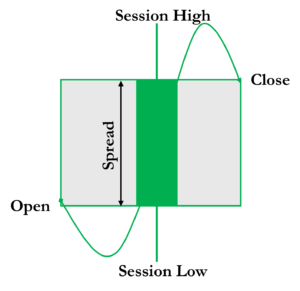
In above figure, we see price action illustrated as a sine wave. In this case, buyers emerge victorious. However, price could have taken any number of paths to form the same candle.
What matters most is the final form of the candle because that is what reveals who won the battle during that session.
-
- Did buyers dominate with a strong bullish body?
- Did sellers push back, leaving a long upper wick?
- Or did neither side take control, resulting in indecision?
When you start viewing candlesticks as mini-battles in the larger war of market psychology, candlestick analysis becomes much more meaningful than memorizing patterns alone.
The Spread: Market Sentiment in Motion
The first thing your eyes should catch about individual candlestick is the body size of the candle. Think of it as the knob of conviction in the market.
-
A Wide Range Candle (large body) shouts confidence. Buyers or sellers had no hesitation. They dominated the session and moved price decisively. Imagine a strong bullish candle surging after a period of hesitation, that is often the spark of momentum.
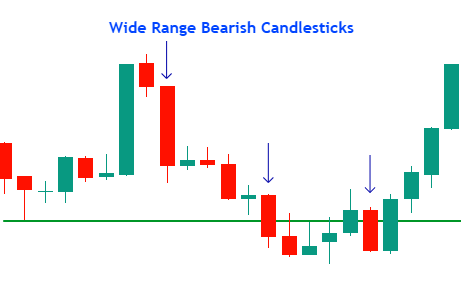
-
A Narrow Range Candle (small body), on the other hand, whispers uncertainty. It signals hesitation, balance, or consolidation. Neither buyers nor sellers were strong enough to take full control.

Seems simple, right? But wait! there is more.
The Power of Wicks: Shadows of the Battle
Wicks tell us the hidden story behind each candle. They represent rejected price levels, moments where the market tested a certain direction before reversing.
Think of an auction: if a product gets multiple bids, the price fluctuates before settling. The same happens in the market. A candle with no wicks suggests price moved steadily in one direction; unwavering conviction from buyers or sellers. But a candle with long wicks tells a different story; a struggle, a tug-of-war, an attempt to push the price one way before it ultimately found balance.
This is the power of the wick. It reveals sentiment shifts hidden within a single candle. And yet, many traders stop at price action alone, ignoring volume entirely.
But why?
Trading Volume is the missing puzzle piece. It validates price movement, confirming whether a shift in sentiment is genuine or merely a fleeting moment of market indecision. If price action traders are reading this, feel free to convince me otherwise, I am always open to learning.
Lower Wick Example
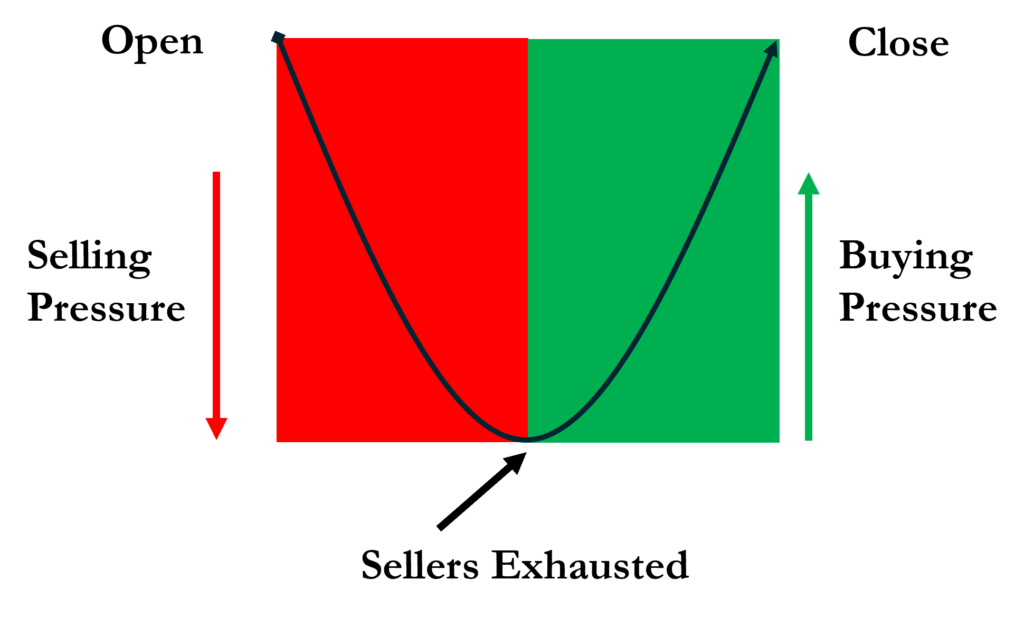
Let’s dive deeper. Imagine a candle forming with a long lower wick. What does that tell us?
The market opens. Immediately, sellers step in, driving prices lower. It is a landslide victory for sellers, who are overwhelmed. The session progresses, and price continues to sink. Perhaps there are brief pauses, small attempts to reverse, but the downward momentum is undeniable.
Then, something shifts. Buyers start creeping back in. The price has dropped to an attractive level, and demand increases. Sellers begin to lose their grip. Slowly, the balance tilts, and buyers start taking control.
By the end of the session, price has recovered completely, closing exactly where it started. The battle is over, and the bulls have won the second half.
But what does this price action reveal? Two key takeaways from this move:
- A full reversal in sentiment – what started as heavy selling turned into strong buying.
- A bullish close – despite early losses, price recovered, signaling buyer strength.
Does this mean an uptrend is coming?
Not necessarily!
You will discover why once we start looking at volume, which will then give us the complete picture.
At the moment we are simply considering candlestick price action, which is only half the picture, but one thing is certain, the wick matters. And a vital part of Price Volume Analysis, as is the spread. In this case the spread was zero, which is just as significant as any large spread of the candle. It shows us that at some point, sellers were in control, only to be overpowered by buyers. Whether this is a turning point or just a temporary shift depends on the broader context and, of course, volume.
Upper Wick Example
Now, let’s flip the scenario. What if the candle has a long upper wick?
This time, buyers take the lead as soon as the session begins. The price surges higher, driven by aggressive demand. Sellers are forced to retreat. It looks like a strong bullish move but then something changes.
The momentum slows. Buyers start struggling. The price reaches a level where sellers feel comfortable stepping in. The market hesitates. Then, selling pressure builds, and just like that, the tide turns.
One by one, buyers begin closing their positions, taking profits. Sellers flood the market, pushing the price lower. By the time the session ends, the gains have been erased, and price closes back at the opening level.
Again, two crucial takeaways from the price action:
- A complete reversal in sentiment – what started as bullish enthusiasm ended in bearish control.
- A bearish close – despite early gains, sellers dominated the second half.
Like before, this does not necessarily mean a major downtrend is forming. The volume tells the real story.
Again, this is a stylized view of the price behaviour. Nevertheless, this is what has happened over the session of the candle, and it makes no difference as to what time frame we are considering. This could be a candle on a 5-minute chart, a daily chart or a weekly chart, and this is where the concept of time comes into play. This type of price action, accompanied with the correct Tradign Volume Analysis, is going to have a significantly greater effect when seen on a daily or weekly chart, then when seen on a 1 minute or 5-minute chart.
This is something we will cover in more detail in the next few articles. But what does this price action look like on a price chart in candle form?
Lower Wick Candle
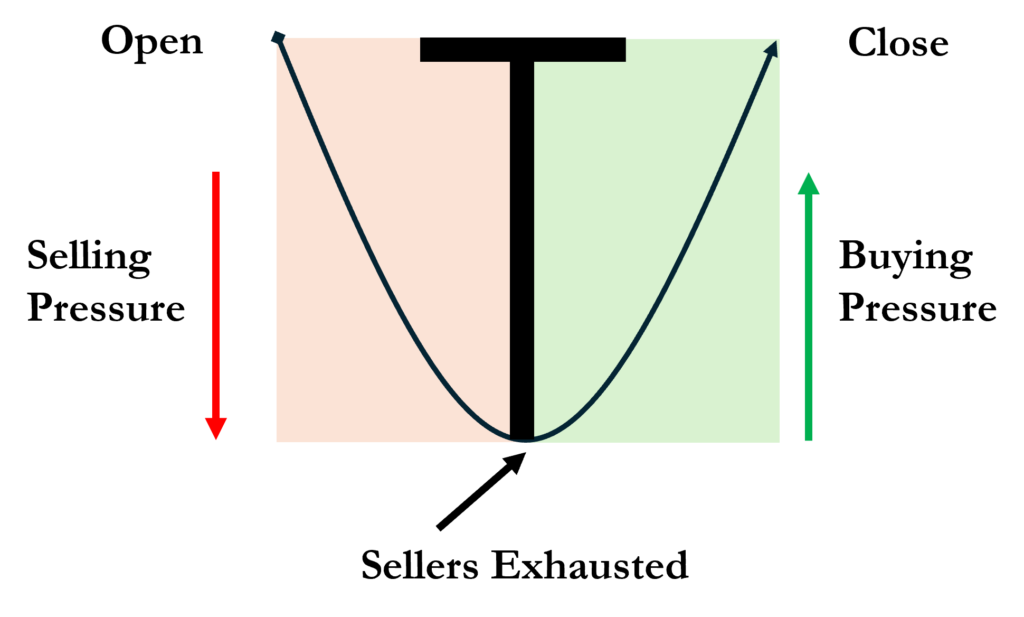
While this candle might not seem particularly exciting at first glance, it holds immense significance in price action, especially when analyzed alongside volume. Together, price action and volume reveal critical clues about where the market is likely headed next.
Now, let’s look at another candle, one that’s just as powerful in its own right.
Upper Wick Candle
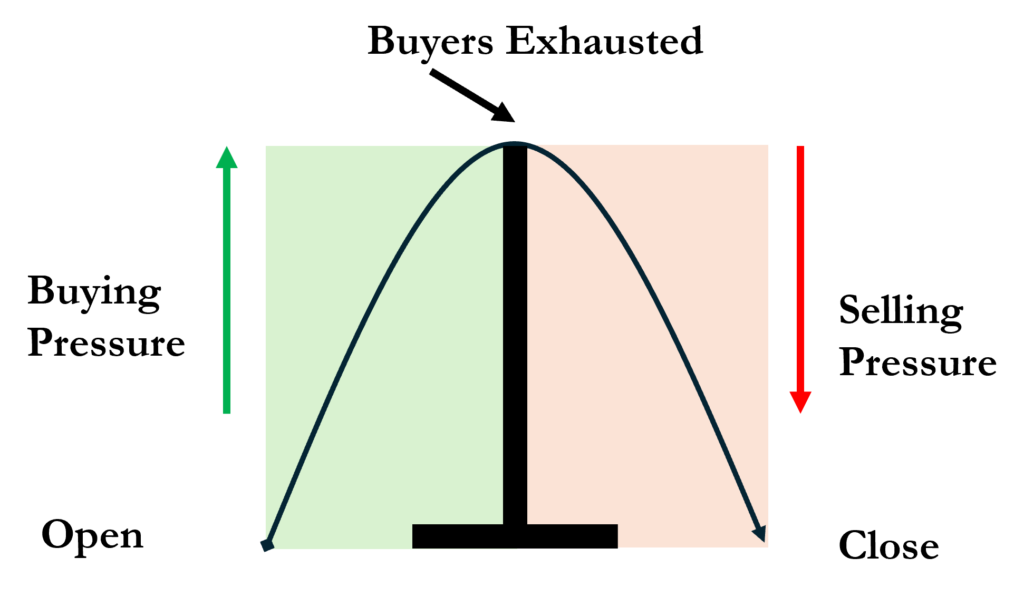
This particular price pattern is one we will revisit time and time again, it is that important. If we were solely focused on price action trading, this might be where the discussion ends. After all, just by analyzing the candle’s wick, we can visualize the battle between buyers and sellers.
Start Looking Beyond Just Candlestick Price Action
But here is the problem: while price action shows us what happened, it does not tell us how strong that movement was or whether it is even reliable. Was the shift in price genuine, or was it just a temporary fake-out? And if it was real, how much momentum does it actually have?
This is where price action alone falls short. It only gives us half the picture.
The missing piece?
Price Volume Analysis.
So, the next time you analyze a candlestick (Hammer, Shooting Star, Inverted Hammer, Hanging Man, Widerange Candle, Bullish Engulfing or Bearish Engulfing), do not just focus on where it opened and closed. Look at the wicks, the spread, and most importantly trading volume. That is where the market true intentions lie.
Now, let me ask you: Next time you see a long wick, will you stop at price action, or will you dig deeper into volume to confirm the story? The market speaks but only if you are willing to listen.
Note: This article is part of Tradonomics Smart Money Secrets with Volume Price Analysis series. Explore it to unlock powerful trading insights and master Volume Price Action!